CHIANG_MAI_MET_STA


Location

lon / lat [deg]: 98.9725 / 18.7711

Source network: AERONET


Geostationary surface albedo (GSA) data


“+000”


“+057/+063”


Landcover information (based on ESA CCI landcover data)


Landcover fractions @ 2km distance


Landcover fractions @ 20 km distance


Legend


Distance to open water bodies [km]:

11.04

Distance to urban areas [km]:

0.3


Radius: 1 km

Number of landcover classes:

4

Dominant landcover type:

190: urban areas

Fraction of dominant landcover type [%]:

41.0


Radius: 2 km

Number of landcover classes:

5

Dominant landcover type:

190: urban areas

Fraction of dominant landcover type [%]:

45.0


Radius: 5 km

Number of landcover classes:

8

Dominant landcover type:

190: urban areas

Fraction of dominant landcover type [%]:

40.0


Radius: 10 km

Number of landcover classes:

9

Dominant landcover type:

10: cropland, rainfed

Fraction of dominant landcover type [%]:

29.0


Radius: 20 km

Number of landcover classes:

9

Dominant landcover type:

10: cropland, rainfed

Fraction of dominant landcover type [%]:

34.0


Disturbances


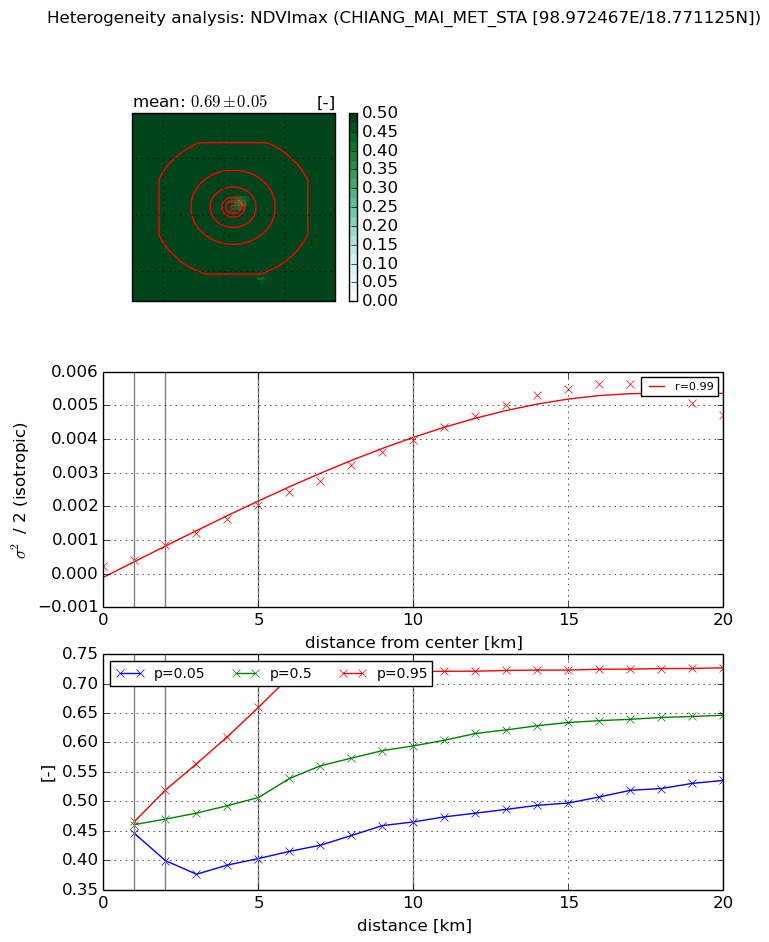
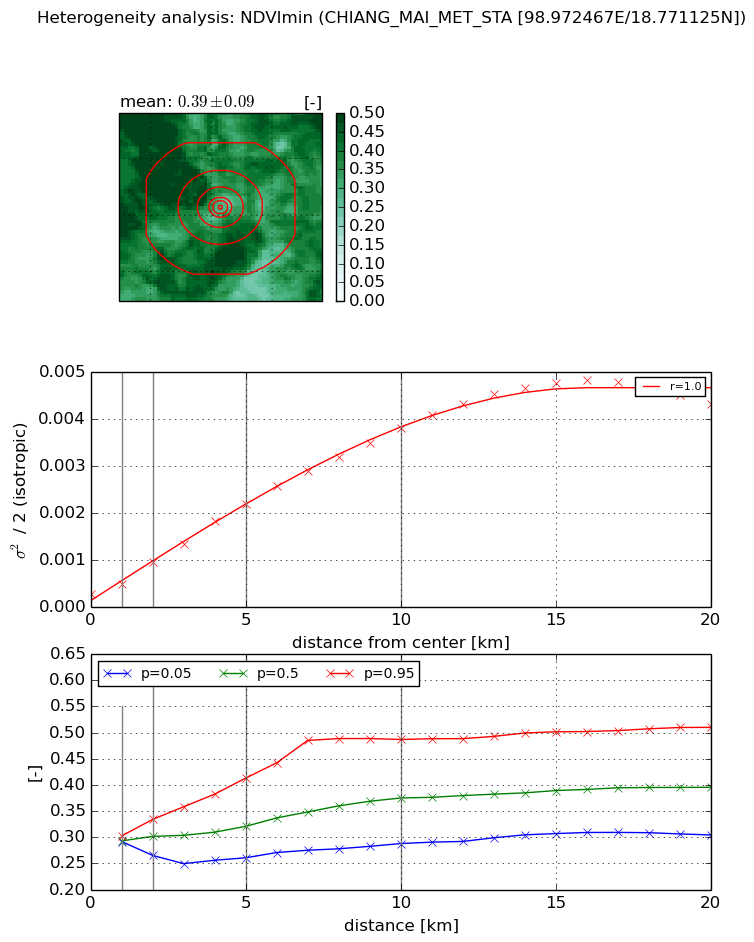
Heterogeneity analysis

The heterogeneity analysis provides information about the spatial and temporal heterogeneity of the site.

Topography


Roman et al. (2009) index


St

0.000184195537962

Rcv

4.26161170997

Rse

0.0

Rst

0.0211602095868

Rsv

16282.7567144


Height range @ 1km [m]

9

Height range @ 2km [m]

18

Height range @ 5km [m]

128

Height range @ 10km [m]

-999

Height range @ 20km [m]

-999


Variance slope @ 1 km

996

Variance slope @ 2 km

1509

Variance slope @ 5 km

1428

Variance slope @ 10 km

-999

Variance slope @ 20 km

-999


NDVI (max. NDVI composite)


Roman et al. (2009) index


St

1.30753261219e-06

Rcv

0.250991795629

Rse

0.0

Rst

0.429965657491

Rsv

2294397.15817


NDVI range @ 1km [-]

0.02

NDVI range @ 2km [-]

0.12

NDVI range @ 5km [-]

0.26

NDVI range @ 10km [-]

0.26

NDVI range @ 20km [-]

0.19


Variance slope @ 1 km

0.000198926594803

Variance slope @ 2 km

0.000319468329094

Variance slope @ 5 km

0.000373624256098

Variance slope @ 10 km

0.000387917600372

Variance slope @ 20 km

0.000282874294738


NDVI (min. NDVI composite)I


Roman et al. (2009) index


St

5.14368277212

Rcv

0.303248701425

Rse

0.0

Rst

0.122152868548

Rsv

0.157838130628


NDVI range @ 1km [-]

0.01

NDVI range @ 2km [-]

0.07

NDVI range @ 5km [-]

0.15

NDVI range @ 10km [-]

0.2

NDVI range @ 20km [-]

0.21


NDVI slope @ 1 km

0.000226243158436

NDVI slope @ 2 km

0.000338449067916

NDVI slope @ 5 km

0.000397180711737

NDVI slope @ 10 km

0.000365815680845

NDVI slope @ 20 km

0.000230296512534


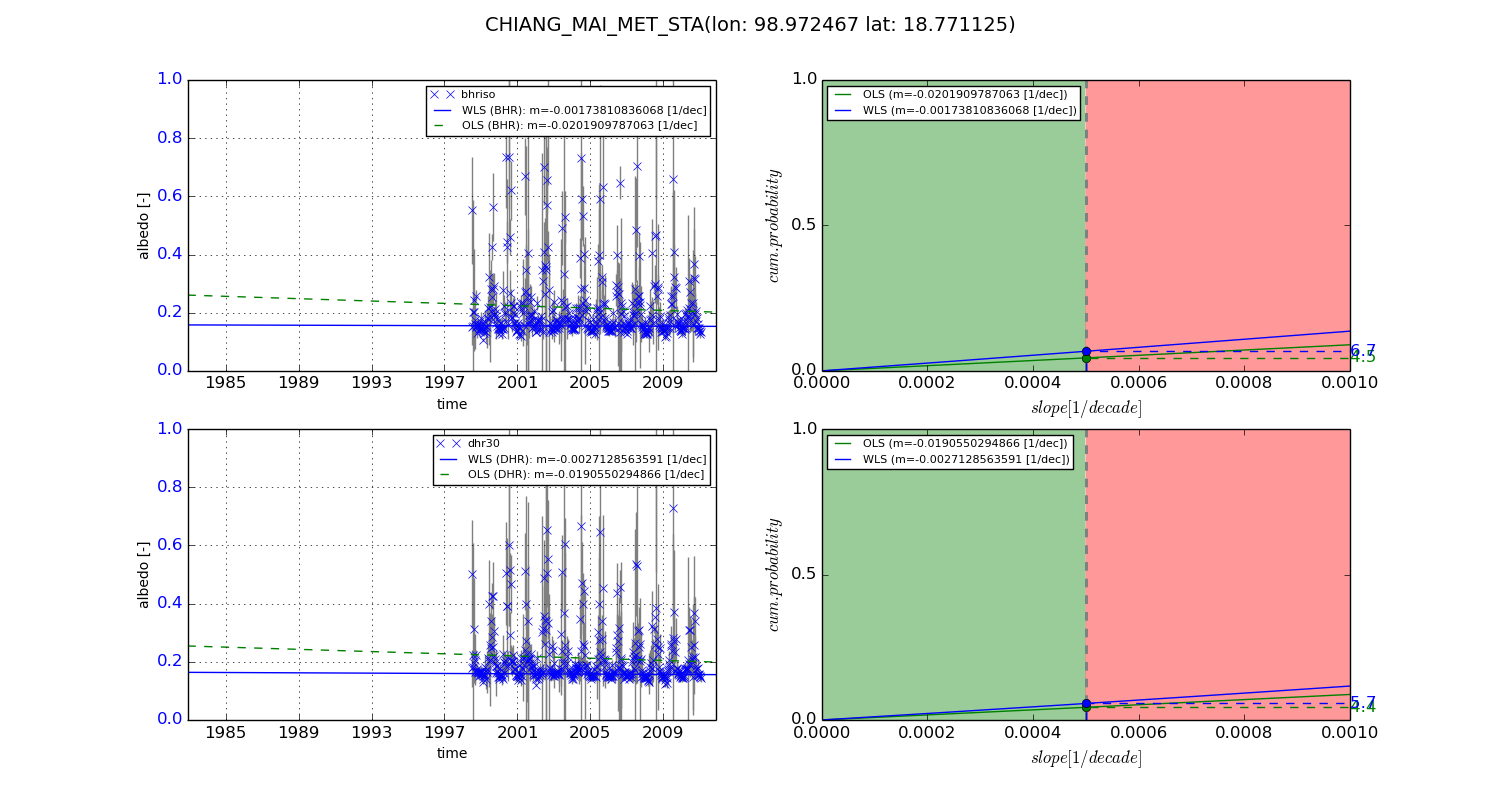
Temporal stability analysis

+000 deg (BHR)


BHR statistics

Temporal stability [1/decade]:


abs

rel


Weighted least square:

None


Ordinary least square:

None


Probabilities that GCOS criteria is met:

Weighted least square:

None %

Ordinary least square:

None %


DHR statistics

Temporal stability [1/decade]:


abs

rel


Weighted least square:

None


Ordinary least square:

None


Probabilities that GCOS criteria is met:

Weighted least square:

None %

Ordinary least square:

None %


+057/+063 deg (BHR)


BHR statistics

Temporal stability [1/decade]:


abs

rel


Weighted least square:

-0.00173810836068


Ordinary least square:

-0.0201909787063


Probabilities that GCOS criteria is met:

Weighted least square:

6.7 %

Ordinary least square:

4.5 %


DHR statistics

Temporal stability [1/decade]:


abs

rel


Weighted least square:

-0.0027128563591


Ordinary least square:

-0.0190550294866


Probabilities that GCOS criteria is met:

Weighted least square:

5.7 %

Ordinary least square:

4.4 %


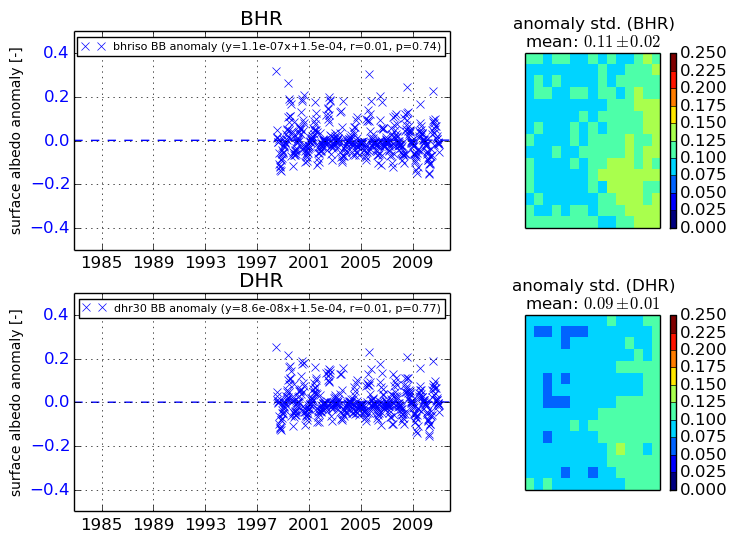
Temporal anomaly analyis

The variance of the temporal anomalies provides an additional measure about the stability of the signal AFTER removal of the mean seasonal cylce.

+000 deg


+057/+063 deg