CN-KU1


Location

lon / lat [deg]: 108.694 / 40.5383

Source network: FLUXNET


Geostationary surface albedo (GSA) data


“+000”


“+057/+063”


Landcover information (based on ESA CCI landcover data)


Landcover fractions @ 2km distance


Landcover fractions @ 20 km distance


Legend


Distance to open water bodies [km]:

5.53

Distance to urban areas [km]:

11.69


Radius: 1 km

Number of landcover classes:

1

Dominant landcover type:

130: grassland

Fraction of dominant landcover type [%]:

100.0


Radius: 2 km

Number of landcover classes:

3

Dominant landcover type:

130: grassland

Fraction of dominant landcover type [%]:

94.0


Radius: 5 km

Number of landcover classes:

5

Dominant landcover type:

130: grassland

Fraction of dominant landcover type [%]:

71.0


Radius: 10 km

Number of landcover classes:

6

Dominant landcover type:

130: grassland

Fraction of dominant landcover type [%]:

43.0


Radius: 20 km

Number of landcover classes:

6

Dominant landcover type:

130: grassland

Fraction of dominant landcover type [%]:

42.0


Disturbances


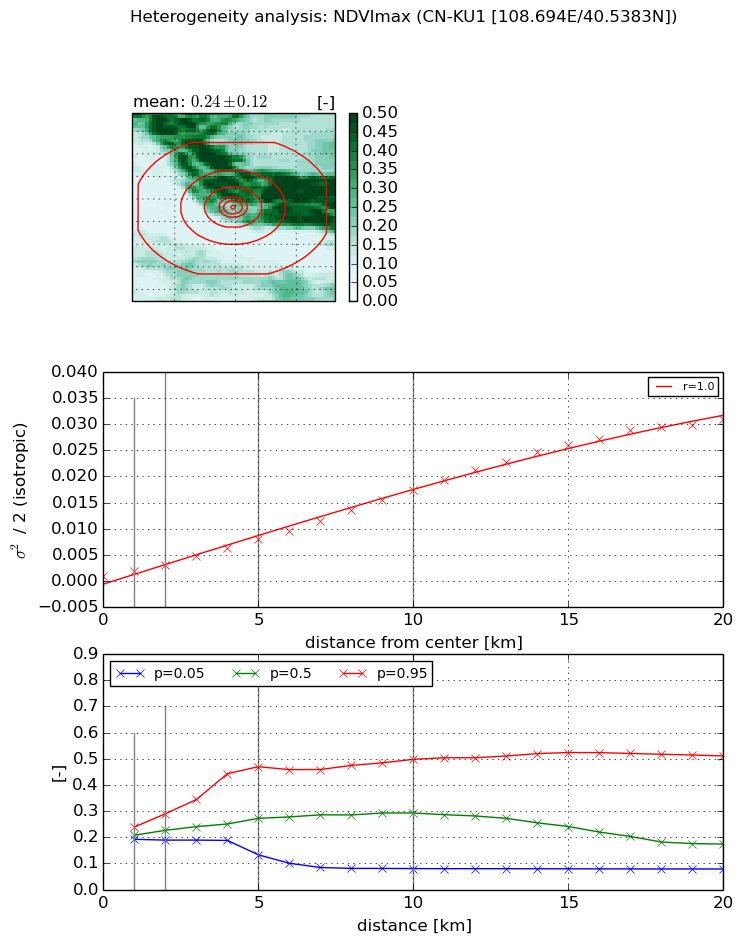
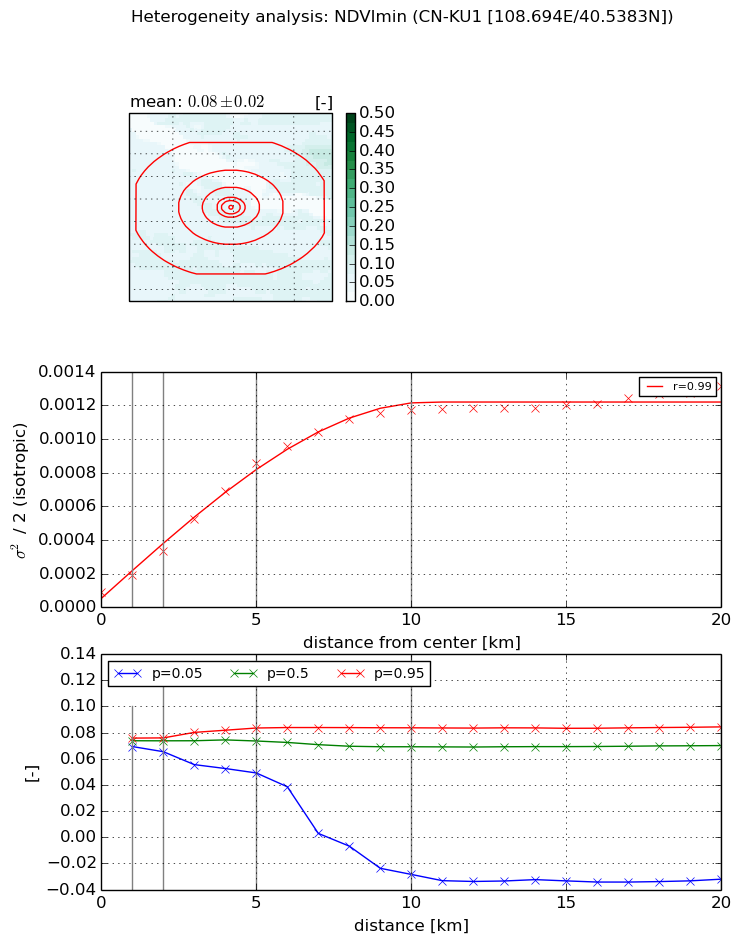
Heterogeneity analysis

The heterogeneity analysis provides information about the spatial and temporal heterogeneity of the site.

Topography


Roman et al. (2009) index


St

1.10265428704

Rcv

0.545086475697

Rse

0.0

Rst

1.52833388666e-05

Rsv

2.17560593264


Height range @ 1km [m]

10

Height range @ 2km [m]

24

Height range @ 5km [m]

47

Height range @ 10km [m]

-999

Height range @ 20km [m]

-999


Variance slope @ 1 km

19

Variance slope @ 2 km

31

Variance slope @ 5 km

61

Variance slope @ 10 km

-999

Variance slope @ 20 km

-999


NDVI (max. NDVI composite)


Roman et al. (2009) index


St

1.60266323335

Rcv

0.568240149564

Rse

0.0

Rst

-0.303644155821

Rsv

-0.999999904326


NDVI range @ 1km [-]

0.05

NDVI range @ 2km [-]

0.1

NDVI range @ 5km [-]

0.34

NDVI range @ 10km [-]

0.42

NDVI range @ 20km [-]

0.43


Variance slope @ 1 km

0.000953884714373

Variance slope @ 2 km

0.00111905936342

Variance slope @ 5 km

0.00145991789465

Variance slope @ 10 km

0.00168949390174

Variance slope @ 20 km

0.00163683362201


NDVI (min. NDVI composite)I


Roman et al. (2009) index


St

1.36927498319

Rcv

0.756239147094

Rse

0.0

Rst

-0.434701343221

Rsv

-0.999999997773


NDVI range @ 1km [-]

0.01

NDVI range @ 2km [-]

0.01

NDVI range @ 5km [-]

0.03

NDVI range @ 10km [-]

0.11

NDVI range @ 20km [-]

0.12


NDVI slope @ 1 km

9.93784611974e-05

NDVI slope @ 2 km

0.000121072387723

NDVI slope @ 5 km

0.000158257895871

NDVI slope @ 10 km

0.000117614858997

NDVI slope @ 20 km

5.29702956971e-05


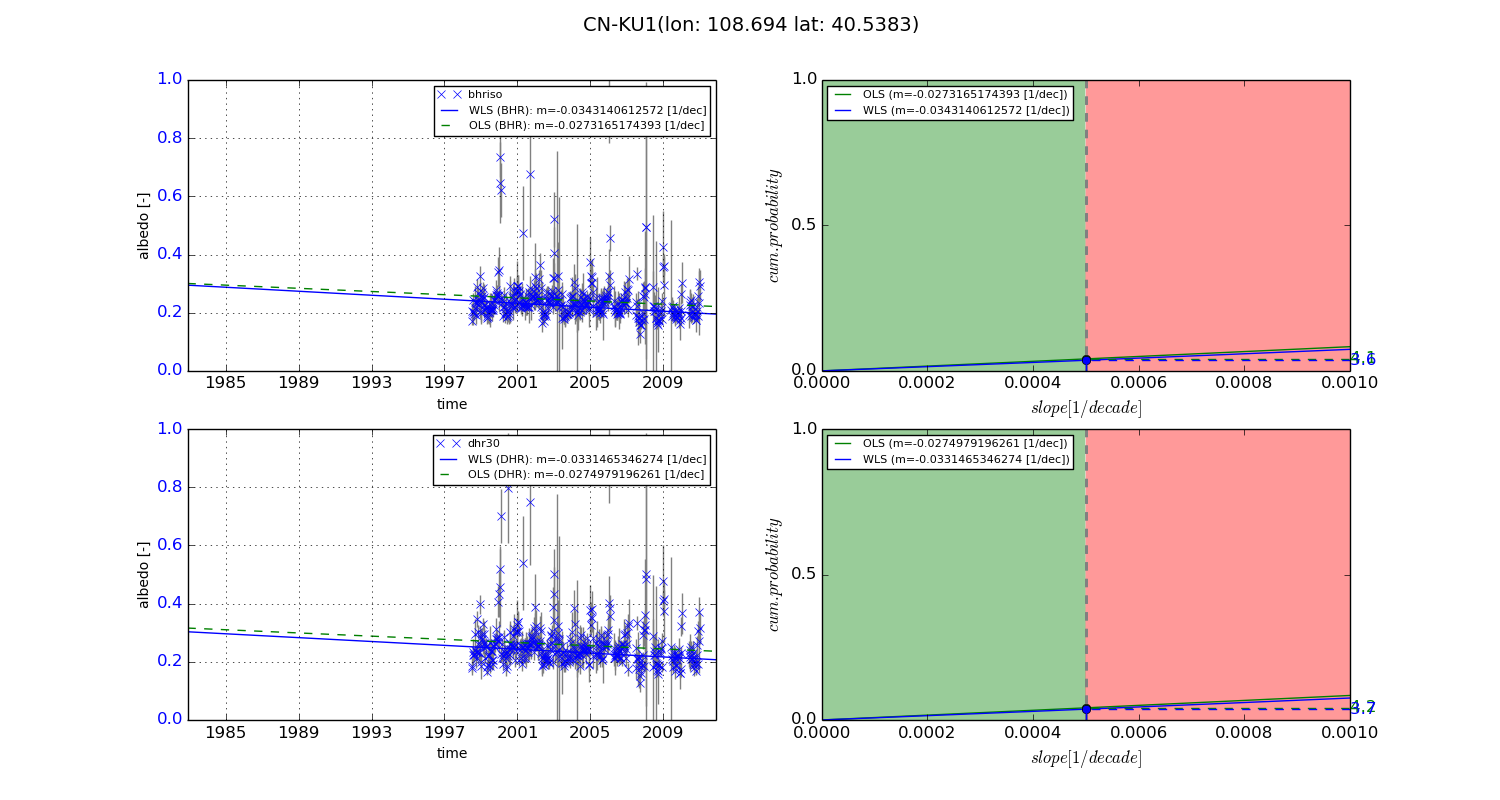
Temporal stability analysis

+000 deg (BHR)


BHR statistics

Temporal stability [1/decade]:


abs

rel


Weighted least square:

None


Ordinary least square:

None


Probabilities that GCOS criteria is met:

Weighted least square:

None %

Ordinary least square:

None %


DHR statistics

Temporal stability [1/decade]:


abs

rel


Weighted least square:

None


Ordinary least square:

None


Probabilities that GCOS criteria is met:

Weighted least square:

None %

Ordinary least square:

None %


+057/+063 deg (BHR)


BHR statistics

Temporal stability [1/decade]:


abs

rel


Weighted least square:

-0.0343140612572


Ordinary least square:

-0.0273165174393


Probabilities that GCOS criteria is met:

Weighted least square:

3.6 %

Ordinary least square:

4.1 %


DHR statistics

Temporal stability [1/decade]:


abs

rel


Weighted least square:

-0.0331465346274


Ordinary least square:

-0.0274979196261


Probabilities that GCOS criteria is met:

Weighted least square:

3.7 %

Ordinary least square:

4.2 %


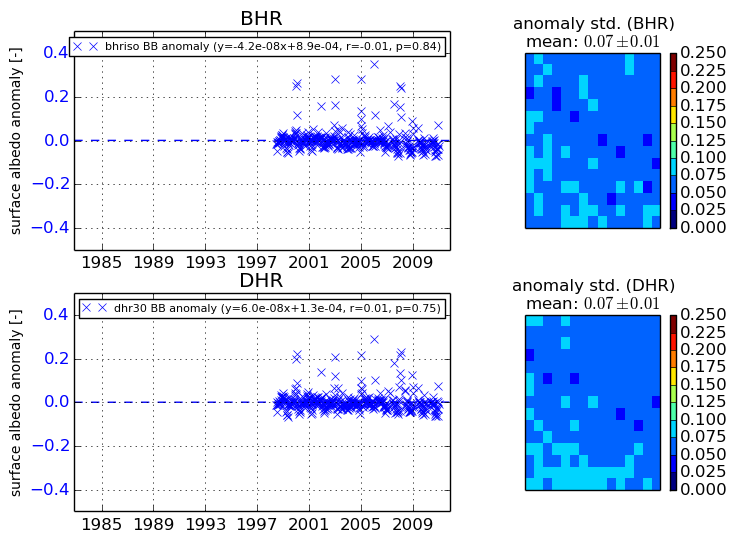
Temporal anomaly analyis

The variance of the temporal anomalies provides an additional measure about the stability of the signal AFTER removal of the mean seasonal cylce.

+000 deg


+057/+063 deg