CZ-BK1


Location

lon / lat [deg]: 18.5384 / 49.5026

Source network: FLUXNET


Geostationary surface albedo (GSA) data


“+000”


“+057/+063”


Landcover information (based on ESA CCI landcover data)


Landcover fractions @ 2km distance


Landcover fractions @ 20 km distance


Legend


Distance to open water bodies [km]:

7.35

Distance to urban areas [km]:

0.56


Radius: 1 km

Number of landcover classes:

2

Dominant landcover type:

70: Tree cover, needleleaved, evergreen, closed to open (>15%)

Fraction of dominant landcover type [%]:

92.0


Radius: 2 km

Number of landcover classes:

3

Dominant landcover type:

70: Tree cover, needleleaved, evergreen, closed to open (>15%)

Fraction of dominant landcover type [%]:

96.0


Radius: 5 km

Number of landcover classes:

2

Dominant landcover type:

70: Tree cover, needleleaved, evergreen, closed to open (>15%)

Fraction of dominant landcover type [%]:

97.0


Radius: 10 km

Number of landcover classes:

5

Dominant landcover type:

70: Tree cover, needleleaved, evergreen, closed to open (>15%)

Fraction of dominant landcover type [%]:

82.0


Radius: 20 km

Number of landcover classes:

9

Dominant landcover type:

70: Tree cover, needleleaved, evergreen, closed to open (>15%)

Fraction of dominant landcover type [%]:

57.0


Disturbances


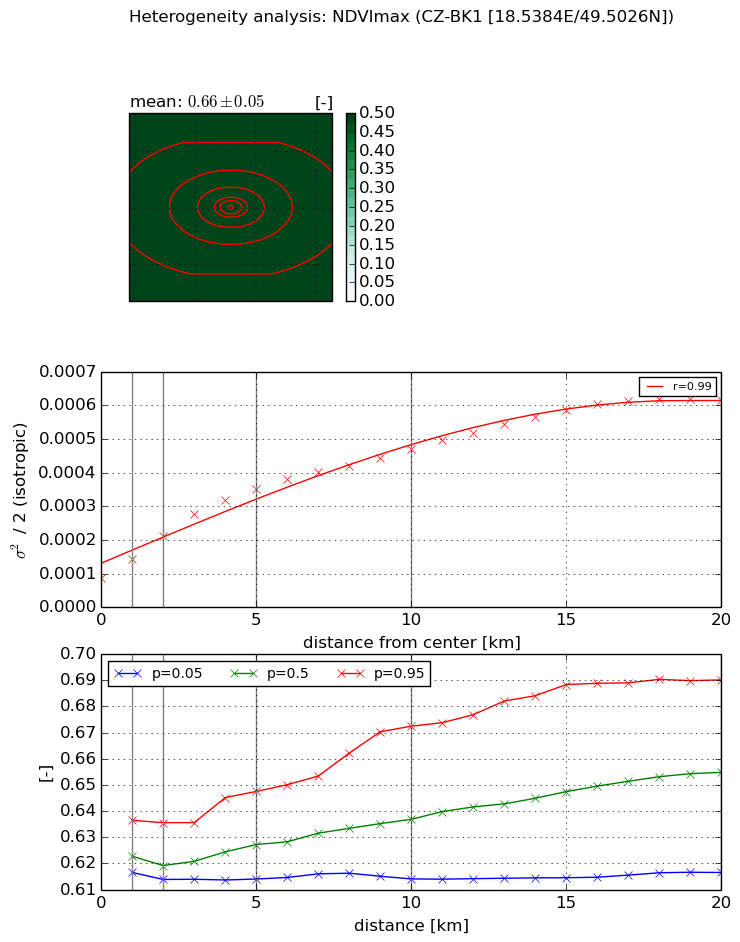
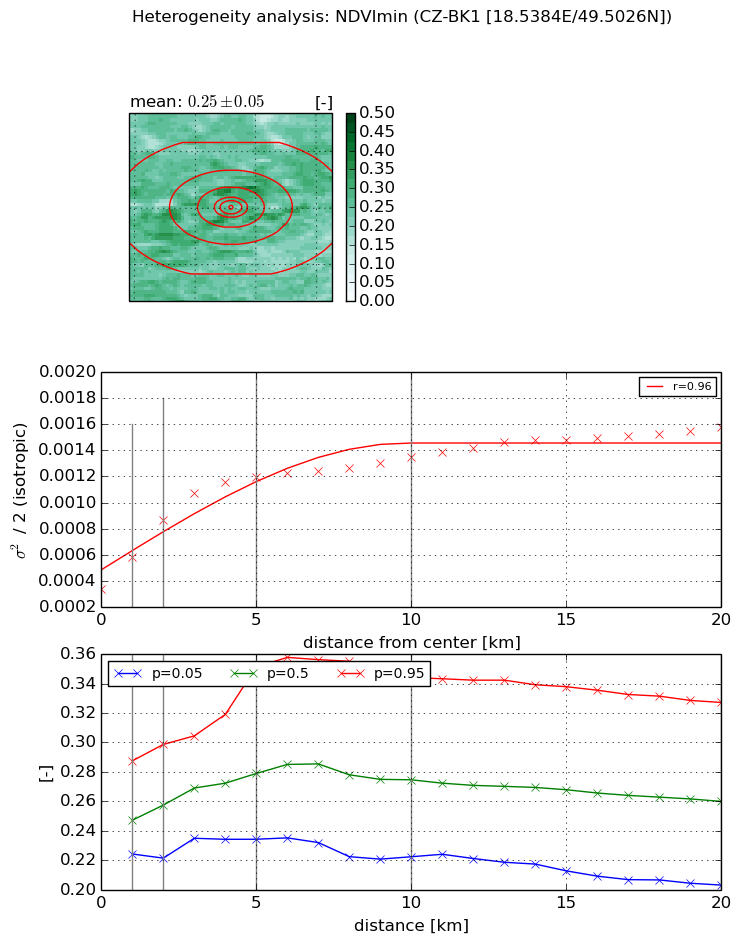
Heterogeneity analysis

The heterogeneity analysis provides information about the spatial and temporal heterogeneity of the site.

Topography


Roman et al. (2009) index


St

2.06016538009

Rcv

0.281554934073

Rse

0.0

Rst

-0.150982374354

Rsv

1.02365646562


Height range @ 1km [m]

181

Height range @ 2km [m]

208

Height range @ 5km [m]

312

Height range @ 10km [m]

-999

Height range @ 20km [m]

-999


Variance slope @ 1 km

4487

Variance slope @ 2 km

3698

Variance slope @ 5 km

1868

Variance slope @ 10 km

-999

Variance slope @ 20 km

-999


NDVI (max. NDVI composite)


Roman et al. (2009) index


St

0.931614251449

Rcv

0.537822374471

Rse

0.0

Rst

-0.566724095775

Rsv

2.11567047613


NDVI range @ 1km [-]

0.02

NDVI range @ 2km [-]

0.02

NDVI range @ 5km [-]

0.03

NDVI range @ 10km [-]

0.06

NDVI range @ 20km [-]

0.07


Variance slope @ 1 km

5.74657725252e-05

Variance slope @ 2 km

6.28455030023e-05

Variance slope @ 5 km

5.46487061149e-05

Variance slope @ 10 km

3.67471391241e-05

Variance slope @ 20 km

2.53346646465e-05


NDVI (min. NDVI composite)I


Roman et al. (2009) index


St

0.659408589117

Rcv

0.272808062041

Rse

0.0

Rst

-0.751772490504

Rsv

3.52495072368


NDVI range @ 1km [-]

0.06

NDVI range @ 2km [-]

0.08

NDVI range @ 5km [-]

0.12

NDVI range @ 10km [-]

0.12

NDVI range @ 20km [-]

0.12


NDVI slope @ 1 km

0.00024543945497

NDVI slope @ 2 km

0.000264848811286

NDVI slope @ 5 km

0.000177368259709

NDVI slope @ 10 km

8.6428306764e-05

NDVI slope @ 20 km

4.5186755682e-05


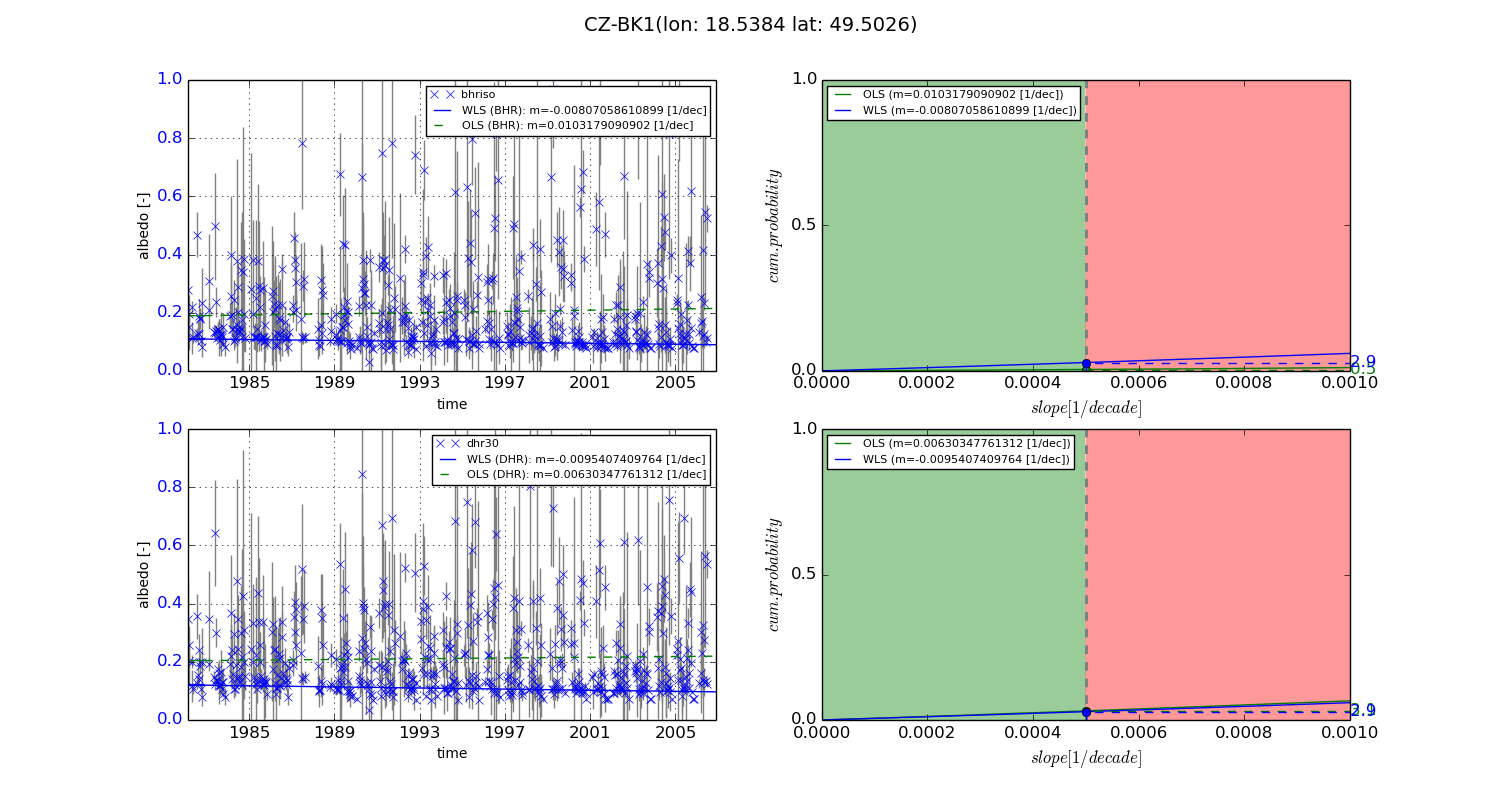
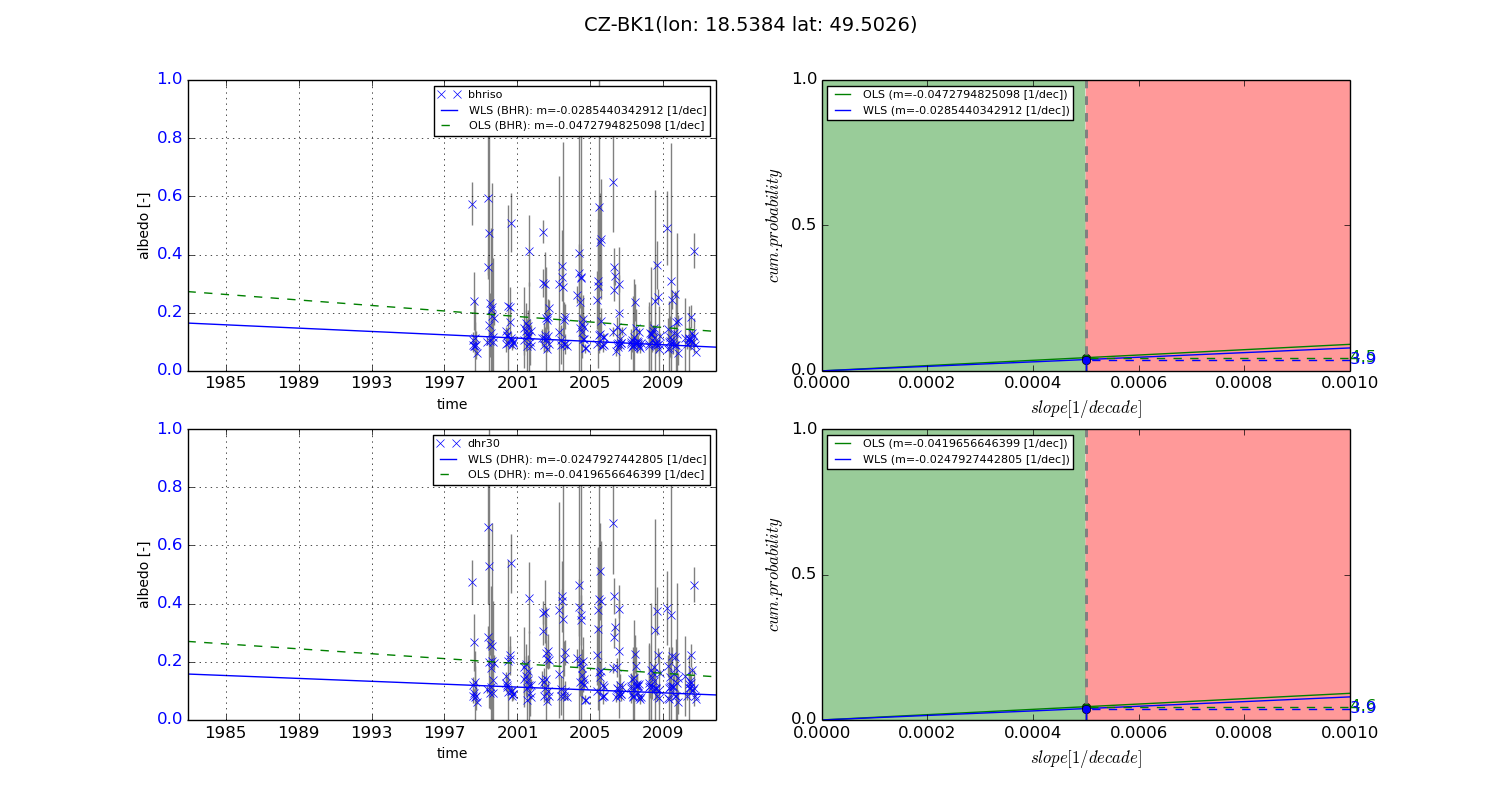
Temporal stability analysis

+000 deg (BHR)


BHR statistics

Temporal stability [1/decade]:


abs

rel


Weighted least square:

-0.00807058610899


Ordinary least square:

0.0103179090902


Probabilities that GCOS criteria is met:

Weighted least square:

2.9 %

Ordinary least square:

0.5 %


DHR statistics

Temporal stability [1/decade]:


abs

rel


Weighted least square:

-0.0095407409764


Ordinary least square:

0.00630347761312


Probabilities that GCOS criteria is met:

Weighted least square:

2.9 %

Ordinary least square:

3.1 %


+057/+063 deg (BHR)


BHR statistics

Temporal stability [1/decade]:


abs

rel


Weighted least square:

-0.0285440342912


Ordinary least square:

-0.0472794825098


Probabilities that GCOS criteria is met:

Weighted least square:

3.9 %

Ordinary least square:

4.5 %


DHR statistics

Temporal stability [1/decade]:


abs

rel


Weighted least square:

-0.0247927442805


Ordinary least square:

-0.0419656646399


Probabilities that GCOS criteria is met:

Weighted least square:

3.9 %

Ordinary least square:

4.6 %


Temporal anomaly analyis

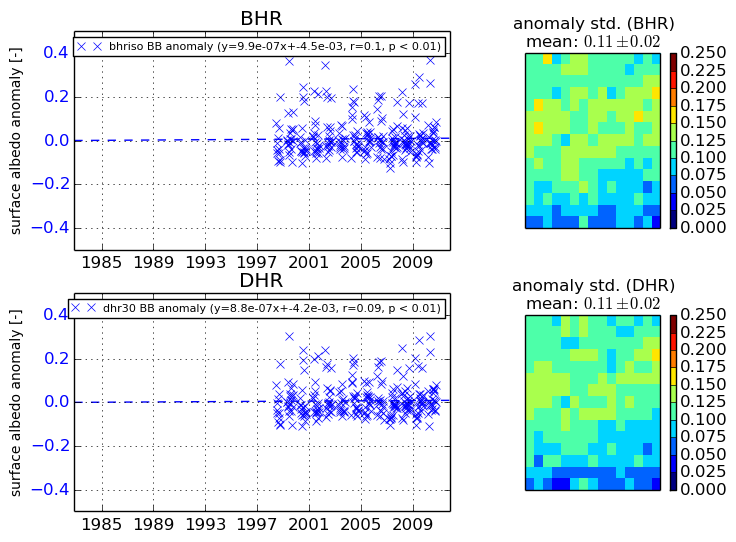
The variance of the temporal anomalies provides an additional measure about the stability of the signal AFTER removal of the mean seasonal cylce.
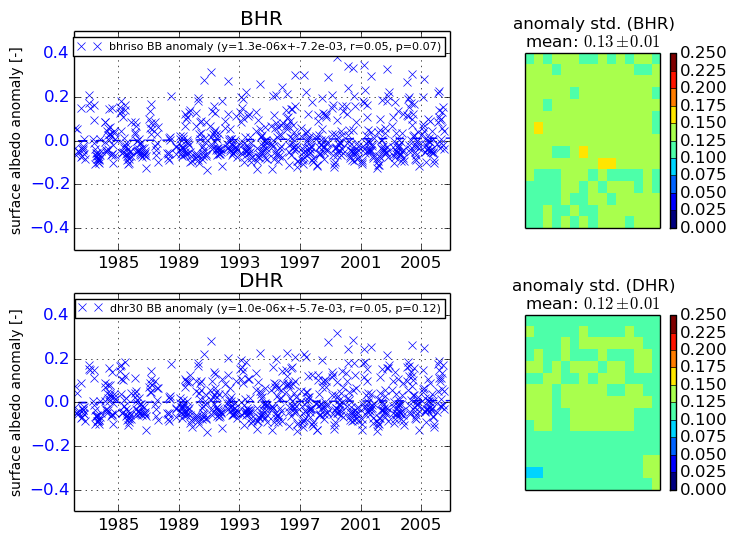
+000 deg


+057/+063 deg