CZ-BK2


Location

lon / lat [deg]: 18.5447 / 49.4953

Source network: FLUXNET


Geostationary surface albedo (GSA) data


“+000”


“+057/+063”


Landcover information (based on ESA CCI landcover data)


Landcover fractions @ 2km distance


Landcover fractions @ 20 km distance


Legend


Distance to open water bodies [km]:

7.93

Distance to urban areas [km]:

0.1


Radius: 1 km

Number of landcover classes:

2

Dominant landcover type:

70: Tree cover, needleleaved, evergreen, closed to open (>15%)

Fraction of dominant landcover type [%]:

89.0


Radius: 2 km

Number of landcover classes:

3

Dominant landcover type:

70: Tree cover, needleleaved, evergreen, closed to open (>15%)

Fraction of dominant landcover type [%]:

95.0


Radius: 5 km

Number of landcover classes:

2

Dominant landcover type:

70: Tree cover, needleleaved, evergreen, closed to open (>15%)

Fraction of dominant landcover type [%]:

93.0


Radius: 10 km

Number of landcover classes:

5

Dominant landcover type:

70: Tree cover, needleleaved, evergreen, closed to open (>15%)

Fraction of dominant landcover type [%]:

82.0


Radius: 20 km

Number of landcover classes:

9

Dominant landcover type:

70: Tree cover, needleleaved, evergreen, closed to open (>15%)

Fraction of dominant landcover type [%]:

59.0


Disturbances


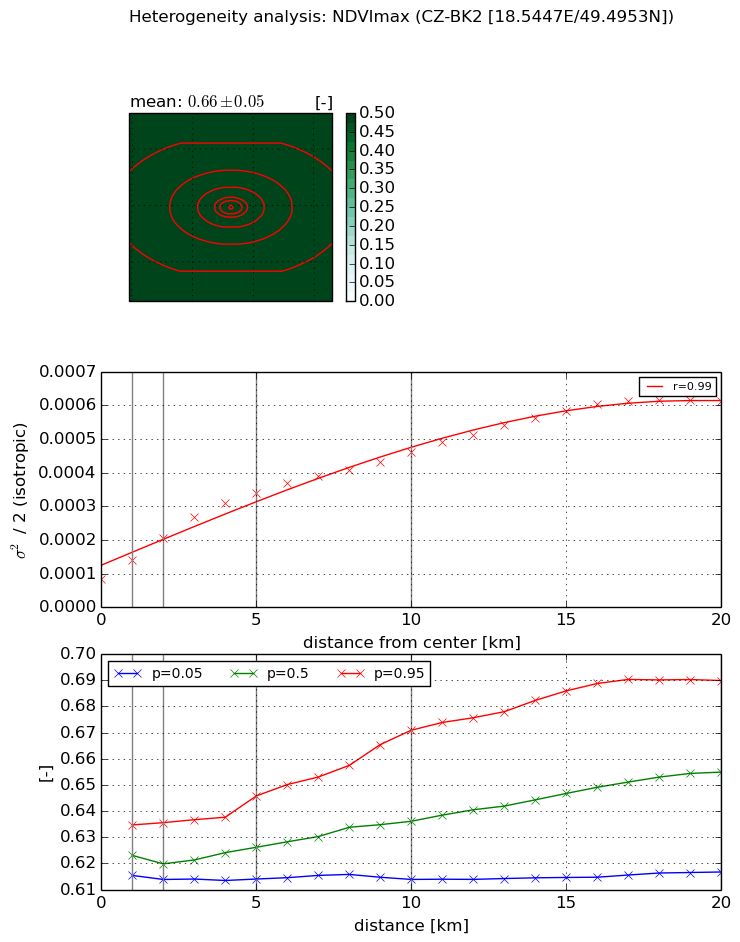
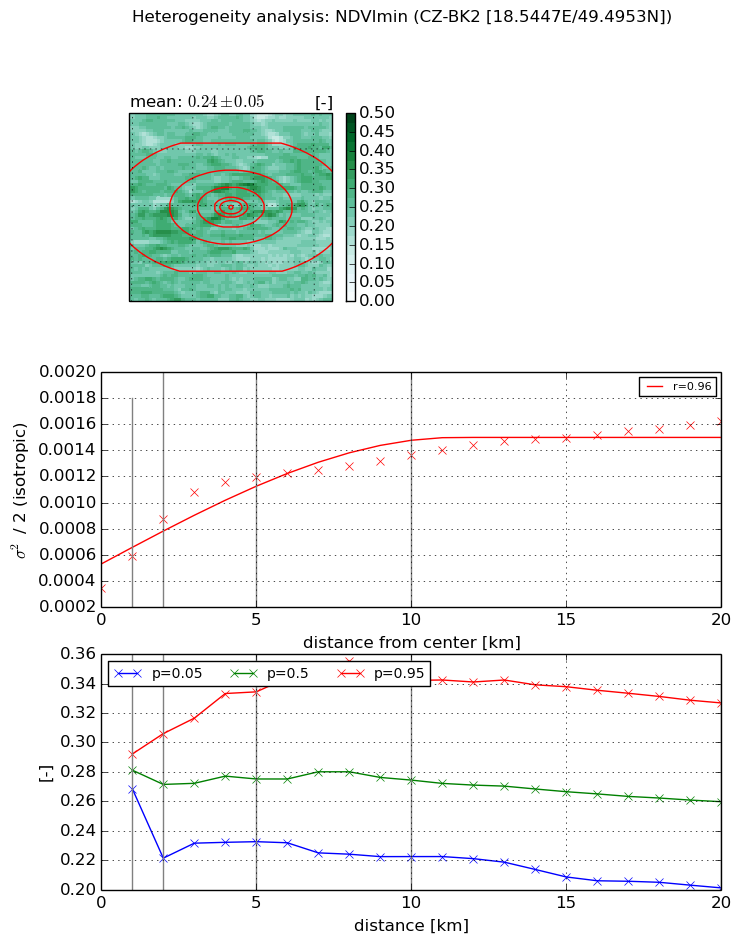
Heterogeneity analysis

The heterogeneity analysis provides information about the spatial and temporal heterogeneity of the site.

Topography


Roman et al. (2009) index


St

1.79470536026

Rcv

0.293319569251

Rse

0.0

Rst

-0.119038170345

Rsv

1.25922583419


Height range @ 1km [m]

153

Height range @ 2km [m]

237

Height range @ 5km [m]

333

Height range @ 10km [m]

-999

Height range @ 20km [m]

-999


Variance slope @ 1 km

4154

Variance slope @ 2 km

3605

Variance slope @ 5 km

1985

Variance slope @ 10 km

-999

Variance slope @ 20 km

-999


NDVI (max. NDVI composite)


Roman et al. (2009) index


St

nan

Rcv

nan

Rse

nan

Rst

nan

Rsv

nan


NDVI range @ 1km [-]

0.02

NDVI range @ 2km [-]

0.02

NDVI range @ 5km [-]

0.03

NDVI range @ 10km [-]

0.06

NDVI range @ 20km [-]

0.07


Variance slope @ 1 km

5.57215279934e-05

Variance slope @ 2 km

6.10009135663e-05

Variance slope @ 5 km

5.30786876504e-05

Variance slope @ 10 km

3.60744193599e-05

Variance slope @ 20 km

2.56324476602e-05


NDVI (min. NDVI composite)I


Roman et al. (2009) index


St

nan

Rcv

nan

Rse

nan

Rst

nan

Rsv

nan


NDVI range @ 1km [-]

0.02

NDVI range @ 2km [-]

0.08

NDVI range @ 5km [-]

0.1

NDVI range @ 10km [-]

0.12

NDVI range @ 20km [-]

0.13


NDVI slope @ 1 km

0.000244831882242

NDVI slope @ 2 km

0.000263926795062

NDVI slope @ 5 km

0.000176299977491

NDVI slope @ 10 km

8.74288433726e-05

NDVI slope @ 20 km

4.71486441864e-05


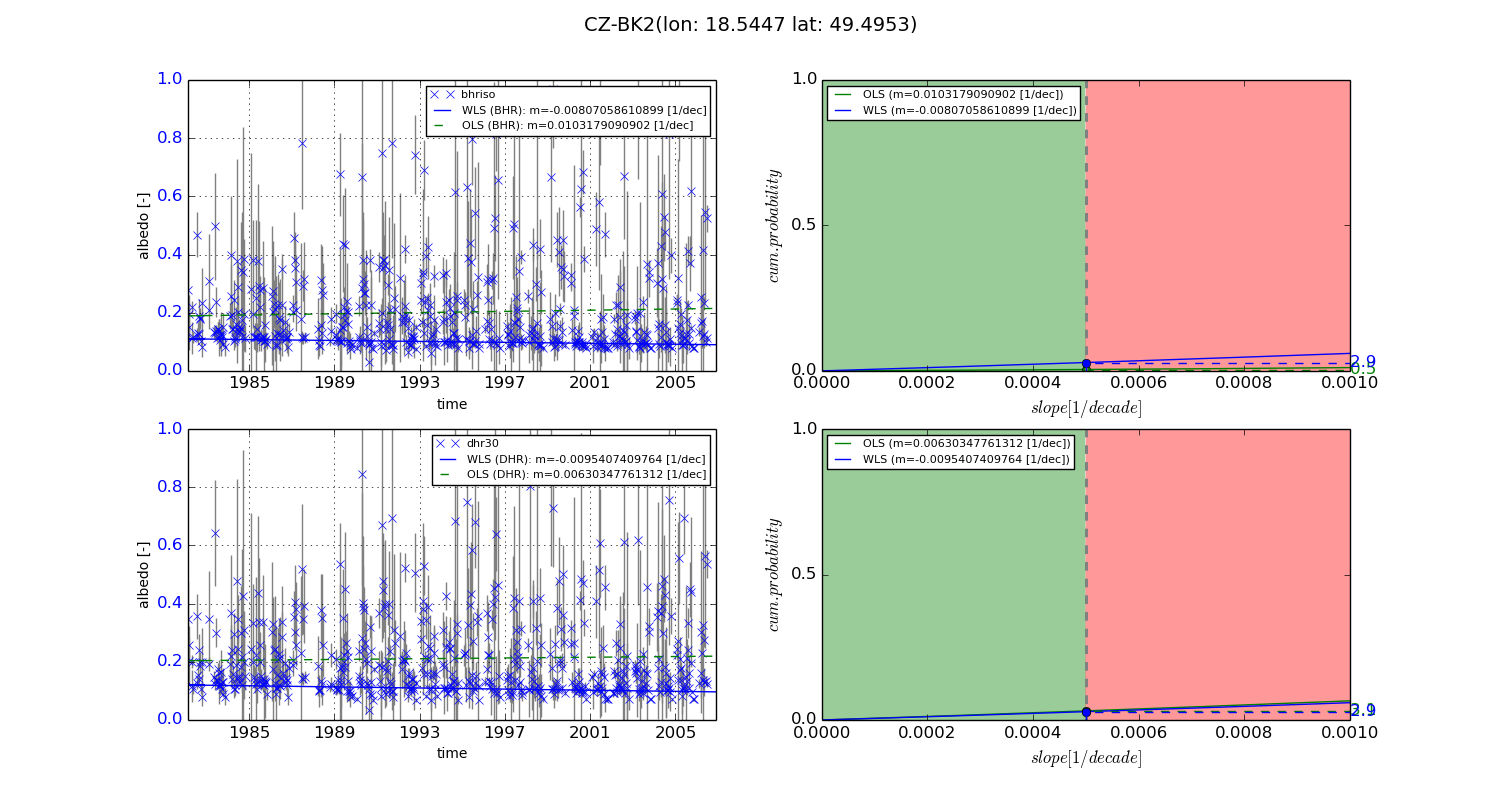
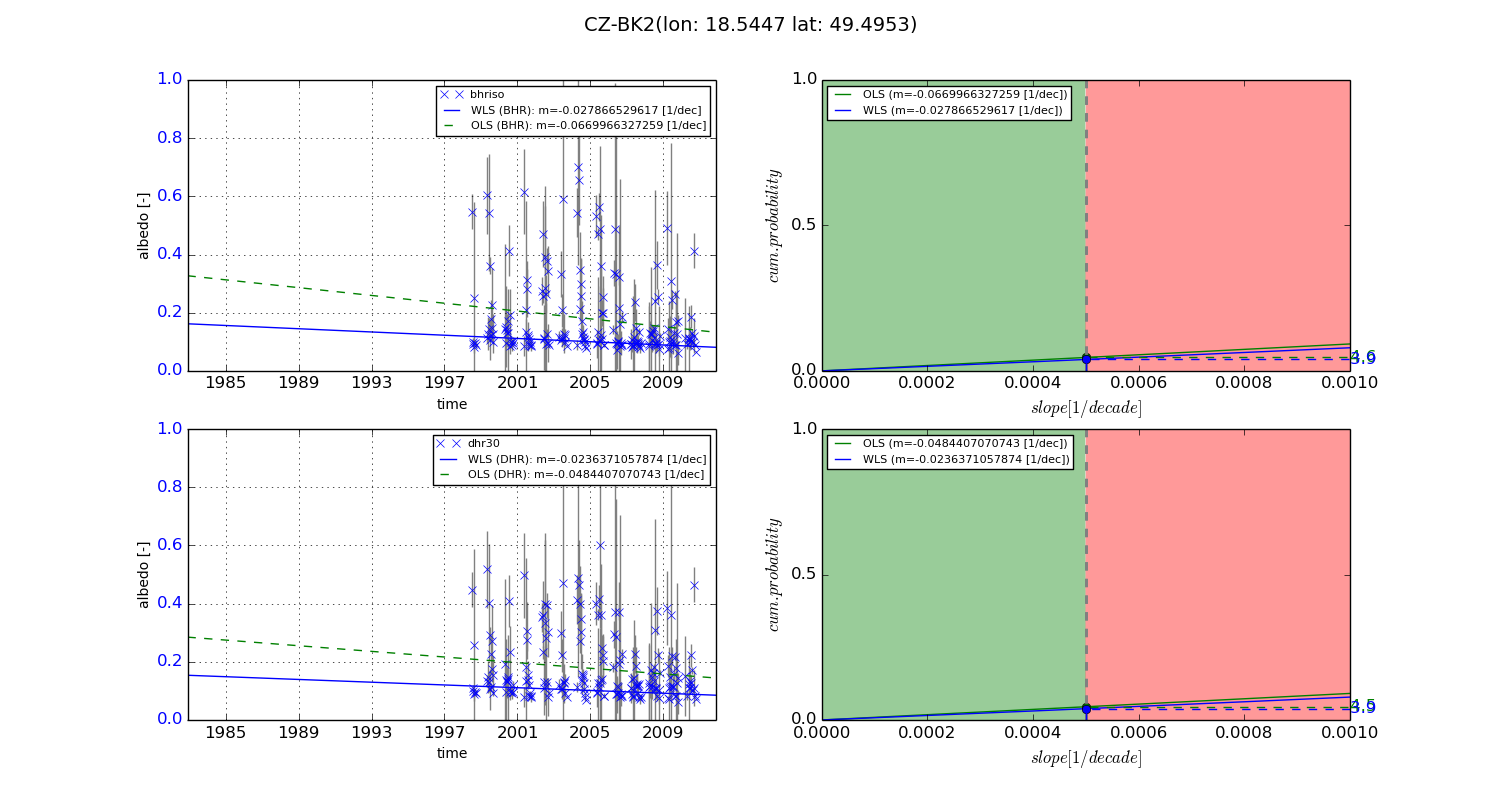
Temporal stability analysis

+000 deg (BHR)


BHR statistics

Temporal stability [1/decade]:


abs

rel


Weighted least square:

-0.00807058610899


Ordinary least square:

0.0103179090902


Probabilities that GCOS criteria is met:

Weighted least square:

2.9 %

Ordinary least square:

0.5 %


DHR statistics

Temporal stability [1/decade]:


abs

rel


Weighted least square:

-0.0095407409764


Ordinary least square:

0.00630347761312


Probabilities that GCOS criteria is met:

Weighted least square:

2.9 %

Ordinary least square:

3.1 %


+057/+063 deg (BHR)


BHR statistics

Temporal stability [1/decade]:


abs

rel


Weighted least square:

-0.027866529617


Ordinary least square:

-0.0669966327259


Probabilities that GCOS criteria is met:

Weighted least square:

3.9 %

Ordinary least square:

4.6 %


DHR statistics

Temporal stability [1/decade]:


abs

rel


Weighted least square:

-0.0236371057874


Ordinary least square:

-0.0484407070743


Probabilities that GCOS criteria is met:

Weighted least square:

3.9 %

Ordinary least square:

4.5 %


Temporal anomaly analyis

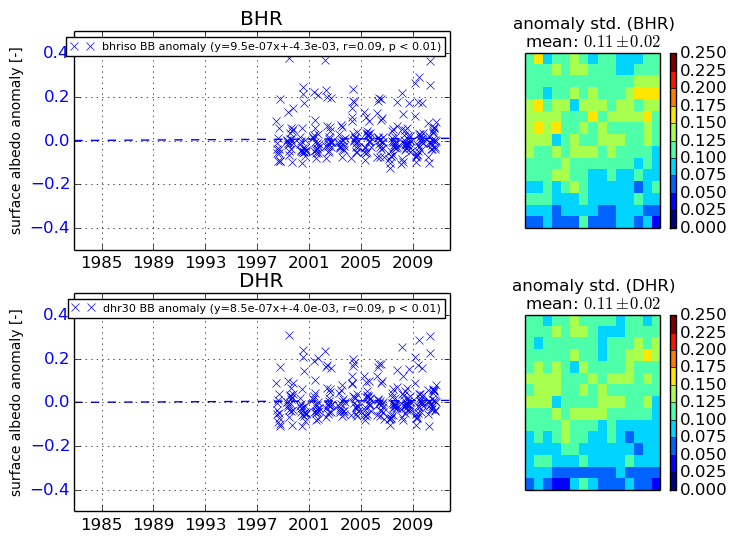
The variance of the temporal anomalies provides an additional measure about the stability of the signal AFTER removal of the mean seasonal cylce.
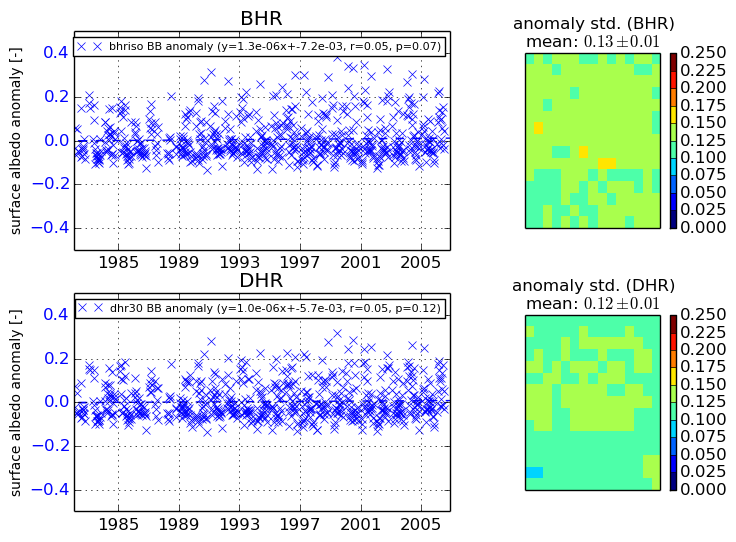
+000 deg


+057/+063 deg