CZ-WET


Location

lon / lat [deg]: 14.772 / 49.025

Source network: FLUXNET


Geostationary surface albedo (GSA) data


“+000”


“+057/+063”


Landcover information (based on ESA CCI landcover data)


Landcover fractions @ 2km distance


Landcover fractions @ 20 km distance


Legend


Distance to open water bodies [km]:

0.47

Distance to urban areas [km]:

0.83


Radius: 1 km

Number of landcover classes:

6

Dominant landcover type:

70: Tree cover, needleleaved, evergreen, closed to open (>15%)

Fraction of dominant landcover type [%]:

33.0


Radius: 2 km

Number of landcover classes:

6

Dominant landcover type:

10: cropland, rainfed

Fraction of dominant landcover type [%]:

24.0


Radius: 5 km

Number of landcover classes:

7

Dominant landcover type:

10: cropland, rainfed

Fraction of dominant landcover type [%]:

31.0


Radius: 10 km

Number of landcover classes:

7

Dominant landcover type:

70: Tree cover, needleleaved, evergreen, closed to open (>15%)

Fraction of dominant landcover type [%]:

40.0


Radius: 20 km

Number of landcover classes:

7

Dominant landcover type:

70: Tree cover, needleleaved, evergreen, closed to open (>15%)

Fraction of dominant landcover type [%]:

41.0


Disturbances


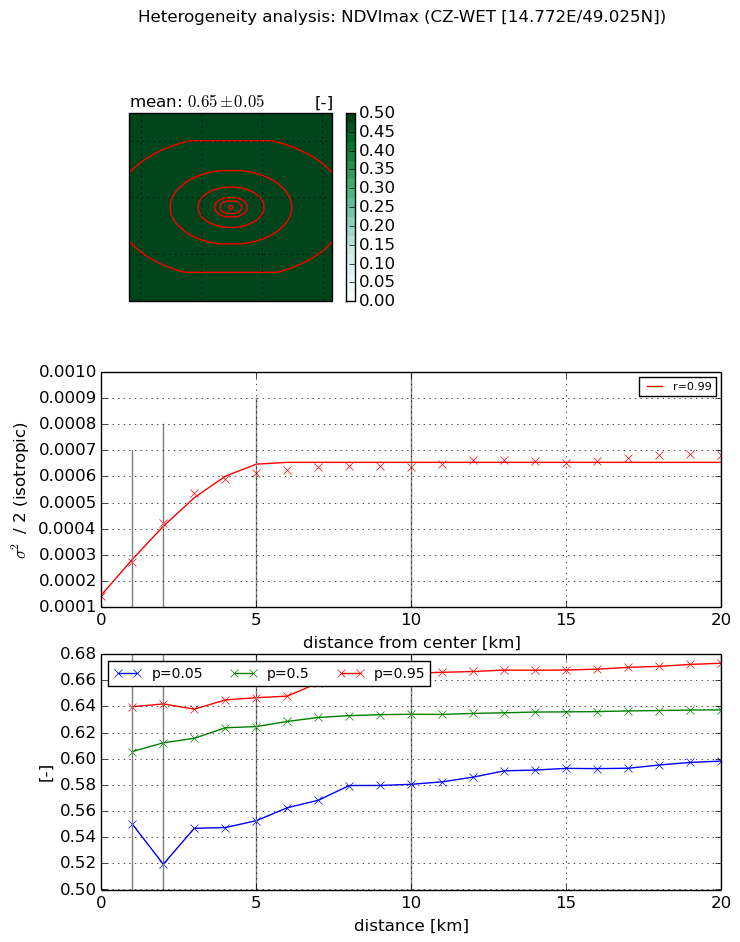
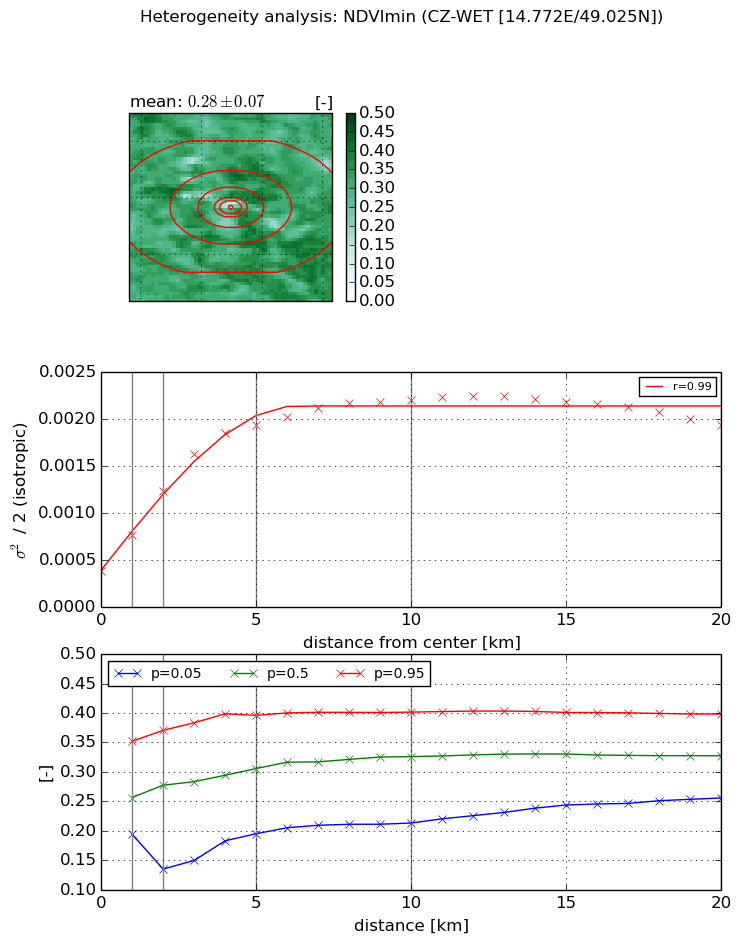
Heterogeneity analysis

The heterogeneity analysis provides information about the spatial and temporal heterogeneity of the site.

Topography


Roman et al. (2009) index


St

3.07164747105

Rcv

0.210808163353

Rse

0.0

Rst

-0.0836367085709

Rsv

0.682229706871


Height range @ 1km [m]

23

Height range @ 2km [m]

24

Height range @ 5km [m]

29

Height range @ 10km [m]

-999

Height range @ 20km [m]

-999


Variance slope @ 1 km

55

Variance slope @ 2 km

50

Variance slope @ 5 km

33

Variance slope @ 10 km

-999

Variance slope @ 20 km

-999


NDVI (max. NDVI composite)


Roman et al. (2009) index


St

1.55623835728

Rcv

-0.166581344783

Rse

0.0

Rst

-1.44631721174

Rsv

-0.314826708671


NDVI range @ 1km [-]

0.09

NDVI range @ 2km [-]

0.12

NDVI range @ 5km [-]

0.09

NDVI range @ 10km [-]

0.09

NDVI range @ 20km [-]

0.07


Variance slope @ 1 km

0.000131387225609

Variance slope @ 2 km

0.000139243784056

Variance slope @ 5 km

9.74304830626e-05

Variance slope @ 10 km

4.3764765389e-05

Variance slope @ 20 km

1.68394895654e-05


NDVI (min. NDVI composite)I


Roman et al. (2009) index


St

5.89905216631

Rcv

-0.113998340298

Rse

0.0

Rst

-0.0679075496148

Rsv

0.326650385811


NDVI range @ 1km [-]

0.16

NDVI range @ 2km [-]

0.24

NDVI range @ 5km [-]

0.2

NDVI range @ 10km [-]

0.19

NDVI range @ 20km [-]

0.14


NDVI slope @ 1 km

0.000380325694676

NDVI slope @ 2 km

0.000423648082262

NDVI slope @ 5 km

0.000326348259368

NDVI slope @ 10 km

0.000170141319415

NDVI slope @ 20 km

5.35090992325e-05


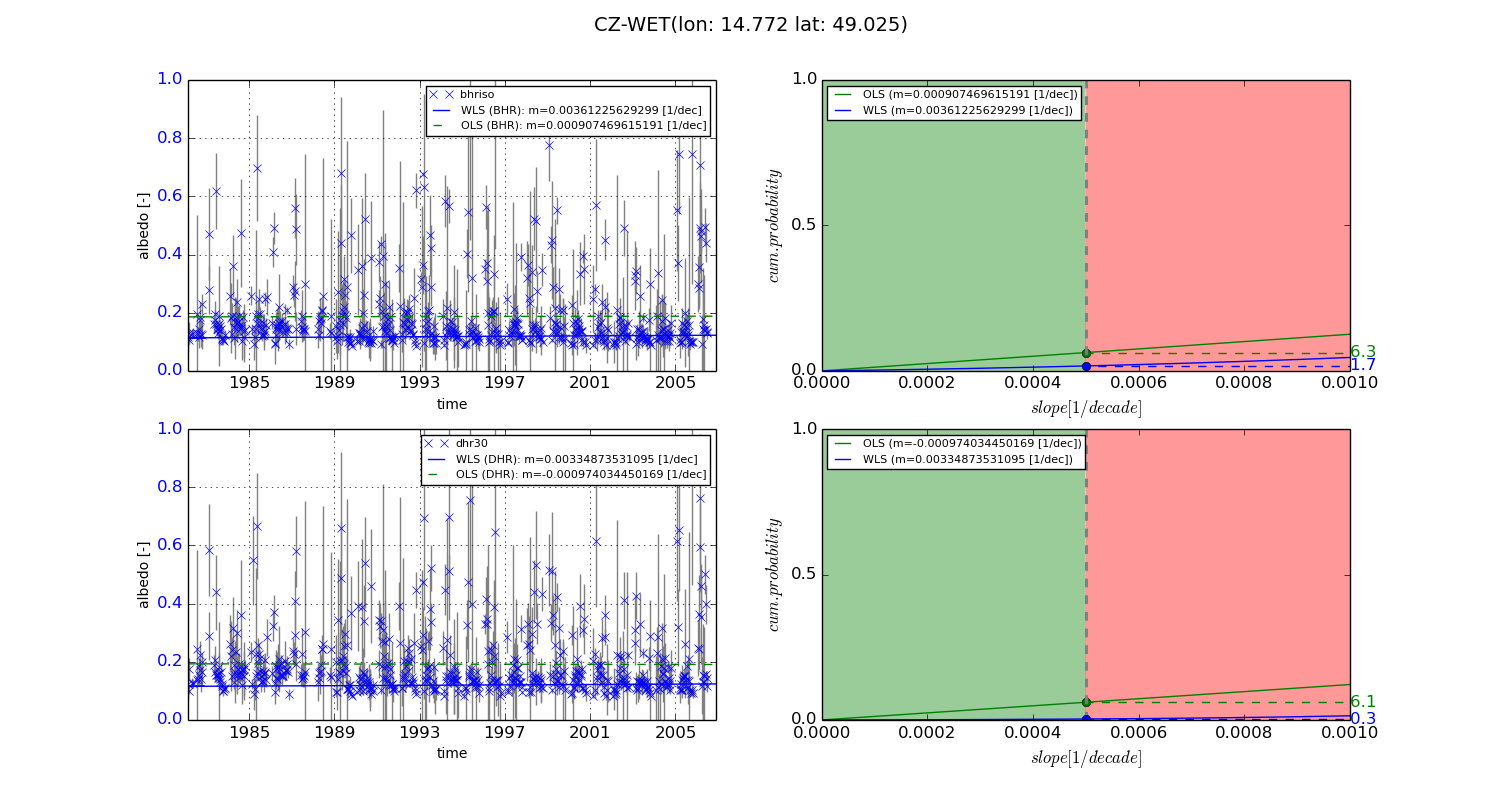
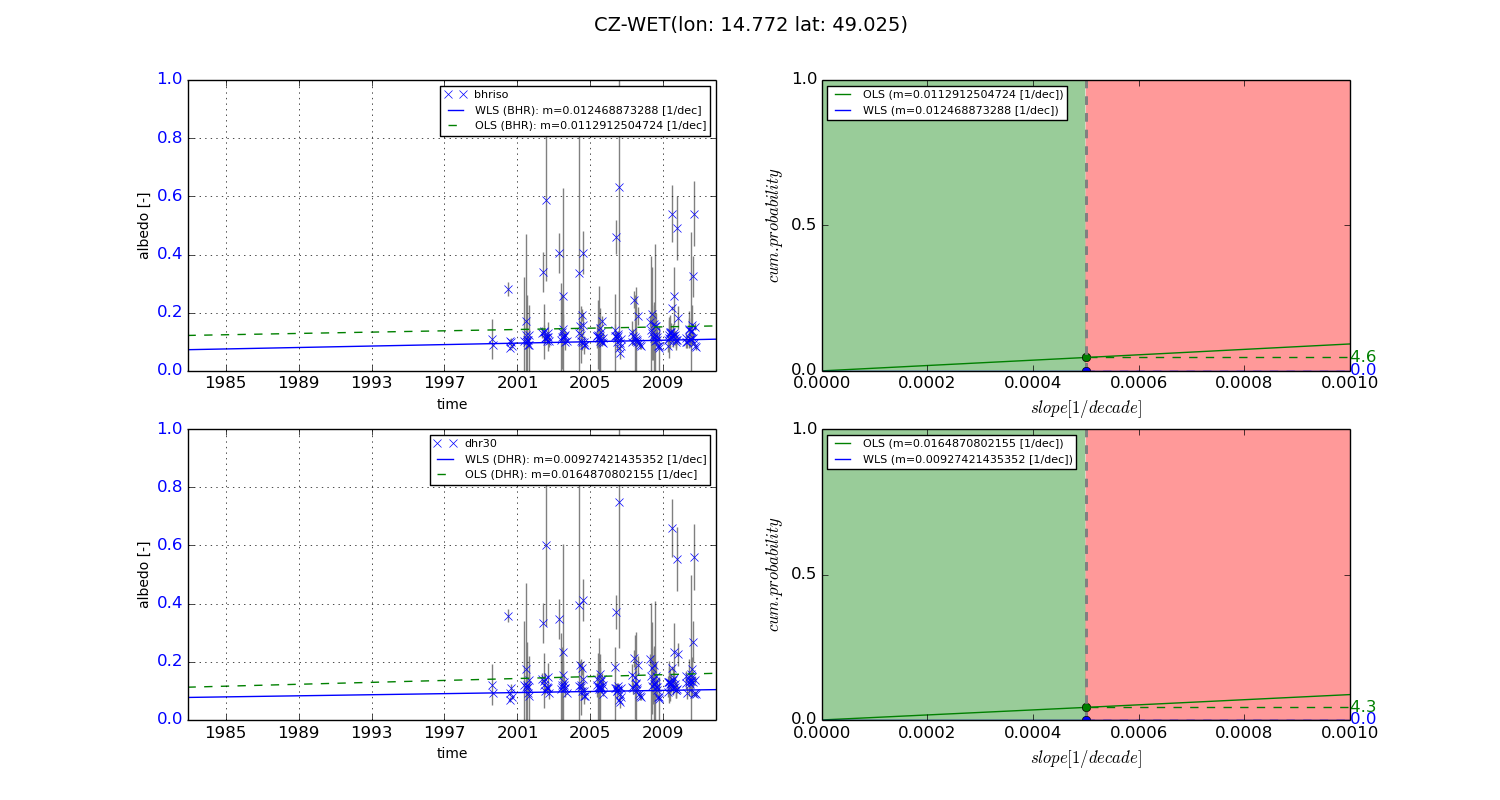
Temporal stability analysis

+000 deg (BHR)


BHR statistics

Temporal stability [1/decade]:


abs

rel


Weighted least square:

0.00361225629299


Ordinary least square:

0.000907469615191


Probabilities that GCOS criteria is met:

Weighted least square:

1.7 %

Ordinary least square:

6.3 %


DHR statistics

Temporal stability [1/decade]:


abs

rel


Weighted least square:

0.00334873531095


Ordinary least square:

-0.000974034450169


Probabilities that GCOS criteria is met:

Weighted least square:

0.3 %

Ordinary least square:

6.1 %


+057/+063 deg (BHR)


BHR statistics

Temporal stability [1/decade]:


abs

rel


Weighted least square:

0.012468873288


Ordinary least square:

0.0112912504724


Probabilities that GCOS criteria is met:

Weighted least square:

0.0 %

Ordinary least square:

4.6 %


DHR statistics

Temporal stability [1/decade]:


abs

rel


Weighted least square:

0.00927421435352


Ordinary least square:

0.0164870802155


Probabilities that GCOS criteria is met:

Weighted least square:

0.0 %

Ordinary least square:

4.3 %


Temporal anomaly analyis

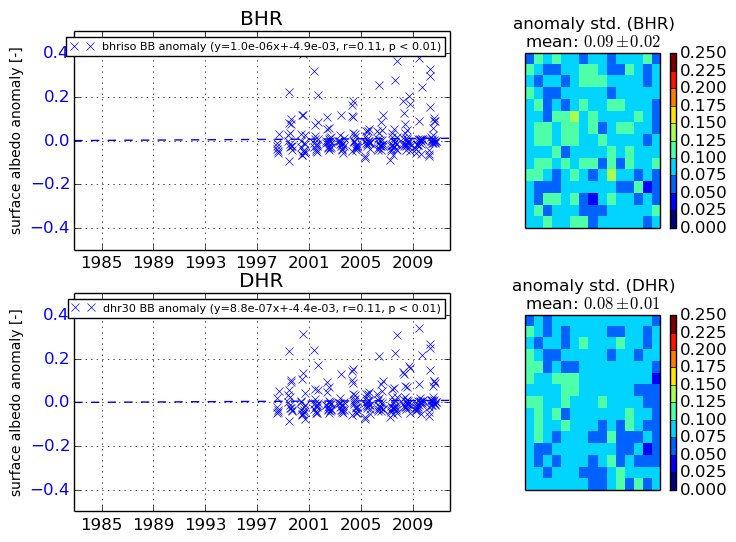
The variance of the temporal anomalies provides an additional measure about the stability of the signal AFTER removal of the mean seasonal cylce.
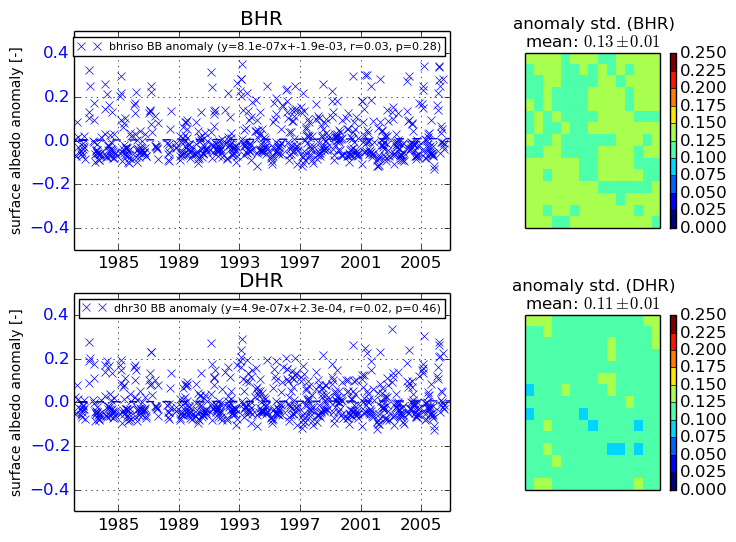
+000 deg


+057/+063 deg