DIRECT_00003


Location

lon / lat [deg]: -72.1729 / 42.5287

Source network: DIRECT


Geostationary surface albedo (GSA) data


“+000”


“+057/+063”


Landcover information (based on ESA CCI landcover data)


Landcover fractions @ 2km distance


Landcover fractions @ 20 km distance


Legend


Distance to open water bodies [km]:

1.86

Distance to urban areas [km]:

1.67


Radius: 1 km

Number of landcover classes:

4

Dominant landcover type:

61: Tree cover, broadleaved, decidous (closed > 40%)

Fraction of dominant landcover type [%]:

45.0


Radius: 2 km

Number of landcover classes:

6

Dominant landcover type:

61: Tree cover, broadleaved, decidous (closed > 40%)

Fraction of dominant landcover type [%]:

58.0


Radius: 5 km

Number of landcover classes:

7

Dominant landcover type:

61: Tree cover, broadleaved, decidous (closed > 40%)

Fraction of dominant landcover type [%]:

58.0


Radius: 10 km

Number of landcover classes:

7

Dominant landcover type:

61: Tree cover, broadleaved, decidous (closed > 40%)

Fraction of dominant landcover type [%]:

46.0


Radius: 20 km

Number of landcover classes:

7

Dominant landcover type:

61: Tree cover, broadleaved, decidous (closed > 40%)

Fraction of dominant landcover type [%]:

29.0


Disturbances


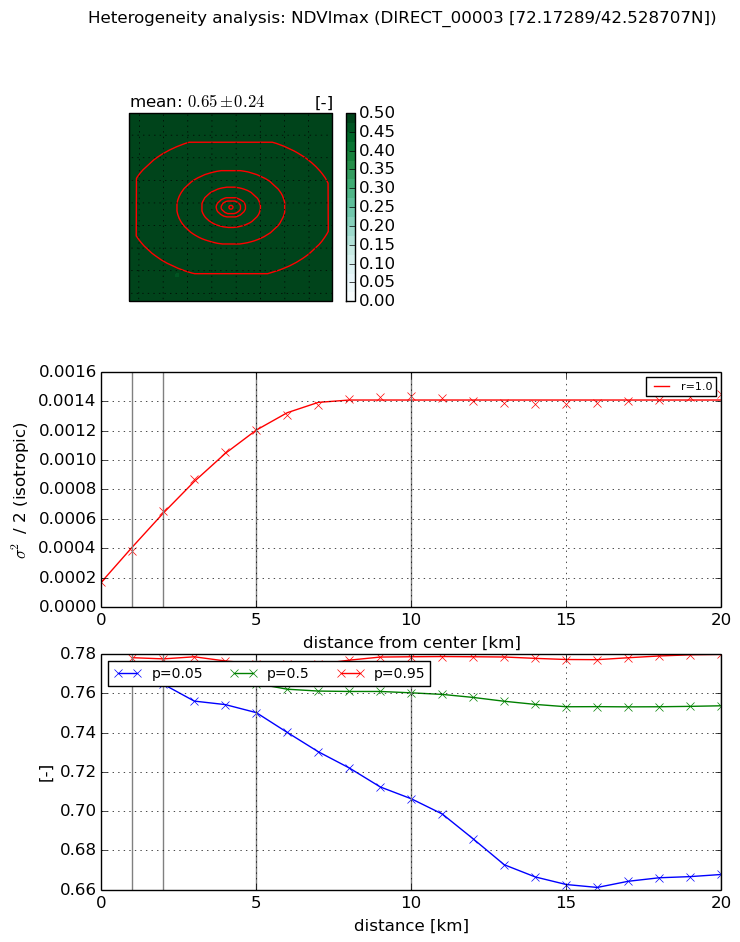
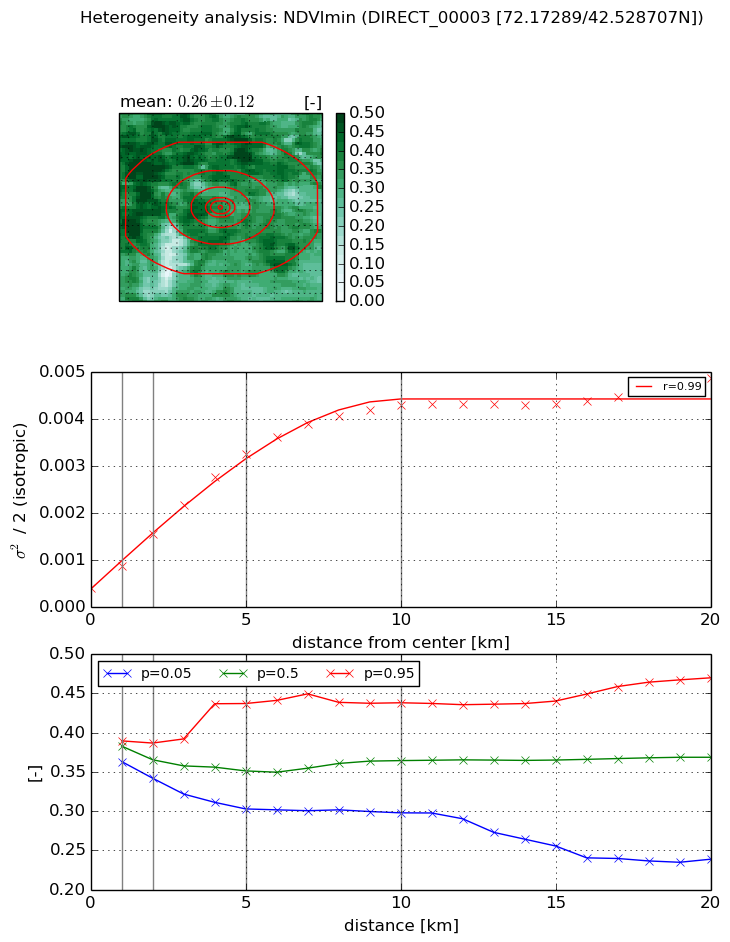
Heterogeneity analysis

The heterogeneity analysis provides information about the spatial and temporal heterogeneity of the site.

Topography


Roman et al. (2009) index


St

0.000863655912311

Rcv

0.281235570087

Rse

0.0

Rst

0.0453613589047

Rsv

3473.27898747


Height range @ 1km [m]

47

Height range @ 2km [m]

86

Height range @ 5km [m]

133

Height range @ 10km [m]

-999

Height range @ 20km [m]

-999


Variance slope @ 1 km

486

Variance slope @ 2 km

486

Variance slope @ 5 km

371

Variance slope @ 10 km

-999

Variance slope @ 20 km

-999


NDVI (max. NDVI composite)


Roman et al. (2009) index


St

5.79167920287

Rcv

0.408458592593

Rse

0.0

Rst

-1.53561667002e-08

Rsv

-0.109525882371


NDVI range @ 1km [-]

0.01

NDVI range @ 2km [-]

0.01

NDVI range @ 5km [-]

0.02

NDVI range @ 10km [-]

0.07

NDVI range @ 20km [-]

0.11


Variance slope @ 1 km

0.000210077882509

Variance slope @ 2 km

0.000240002726349

Variance slope @ 5 km

0.000210780173272

Variance slope @ 10 km

0.000127724100226

Variance slope @ 20 km

4.55870756664e-05


NDVI (min. NDVI composite)I


Roman et al. (2009) index


St

2.11779211178

Rcv

0.747917408086

Rse

0.0

Rst

-0.0497163164323

Rsv

0.61893591105


NDVI range @ 1km [-]

0.03

NDVI range @ 2km [-]

0.04

NDVI range @ 5km [-]

0.13

NDVI range @ 10km [-]

0.14

NDVI range @ 20km [-]

0.23


NDVI slope @ 1 km

0.000468933872203

NDVI slope @ 2 km

0.000569611049005

NDVI slope @ 5 km

0.000587379303329

NDVI slope @ 10 km

0.000405188082231

NDVI slope @ 20 km

0.000180167141586


Temporal stability analysis

+000 deg (BHR)


BHR statistics

Temporal stability [1/decade]:


abs

rel


Weighted least square:

-99999.0


Ordinary least square:

-99999.0


Probabilities that GCOS criteria is met:

Weighted least square:

-99999.0 %

Ordinary least square:

-99999.0 %


DHR statistics

Temporal stability [1/decade]:


abs

rel


Weighted least square:

-99999.0


Ordinary least square:

-99999.0


Probabilities that GCOS criteria is met:

Weighted least square:

-99999.0 %

Ordinary least square:

-99999.0 %


+057/+063 deg (BHR)


BHR statistics

Temporal stability [1/decade]:


abs

rel


Weighted least square:

None


Ordinary least square:

None


Probabilities that GCOS criteria is met:

Weighted least square:

None %

Ordinary least square:

None %


DHR statistics

Temporal stability [1/decade]:


abs

rel


Weighted least square:

None


Ordinary least square:

None


Probabilities that GCOS criteria is met:

Weighted least square:

None %

Ordinary least square:

None %


Temporal anomaly analyis

The variance of the temporal anomalies provides an additional measure about the stability of the signal AFTER removal of the mean seasonal cylce.

+000 deg


+057/+063 deg