DIRECT_00007


Location

lon / lat [deg]: -106.6899 / 34.3509

Source network: DIRECT


Geostationary surface albedo (GSA) data


“+000”


“+057/+063”


Landcover information (based on ESA CCI landcover data)


Landcover fractions @ 2km distance


Landcover fractions @ 20 km distance


Legend


Distance to open water bodies [km]:

12.35

Distance to urban areas [km]:

11.7


Radius: 1 km

Number of landcover classes:

1

Dominant landcover type:

130: grassland

Fraction of dominant landcover type [%]:

100.0


Radius: 2 km

Number of landcover classes:

1

Dominant landcover type:

130: grassland

Fraction of dominant landcover type [%]:

100.0


Radius: 5 km

Number of landcover classes:

2

Dominant landcover type:

130: grassland

Fraction of dominant landcover type [%]:

85.0


Radius: 10 km

Number of landcover classes:

2

Dominant landcover type:

130: grassland

Fraction of dominant landcover type [%]:

56.0


Radius: 20 km

Number of landcover classes:

4

Dominant landcover type:

120: Shrubland

Fraction of dominant landcover type [%]:

54.0


Disturbances


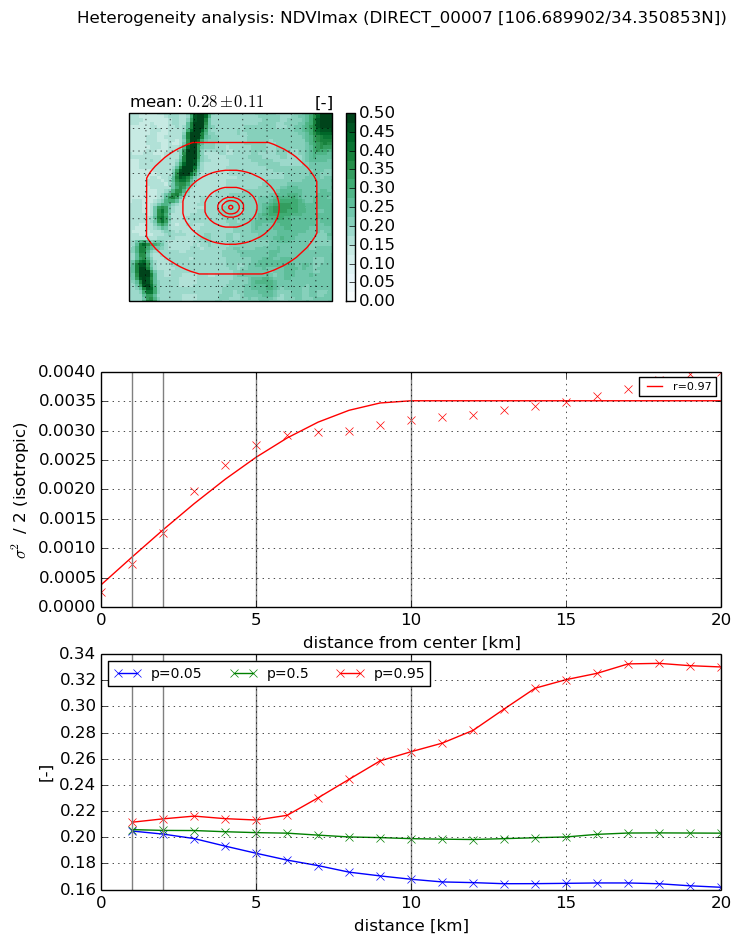
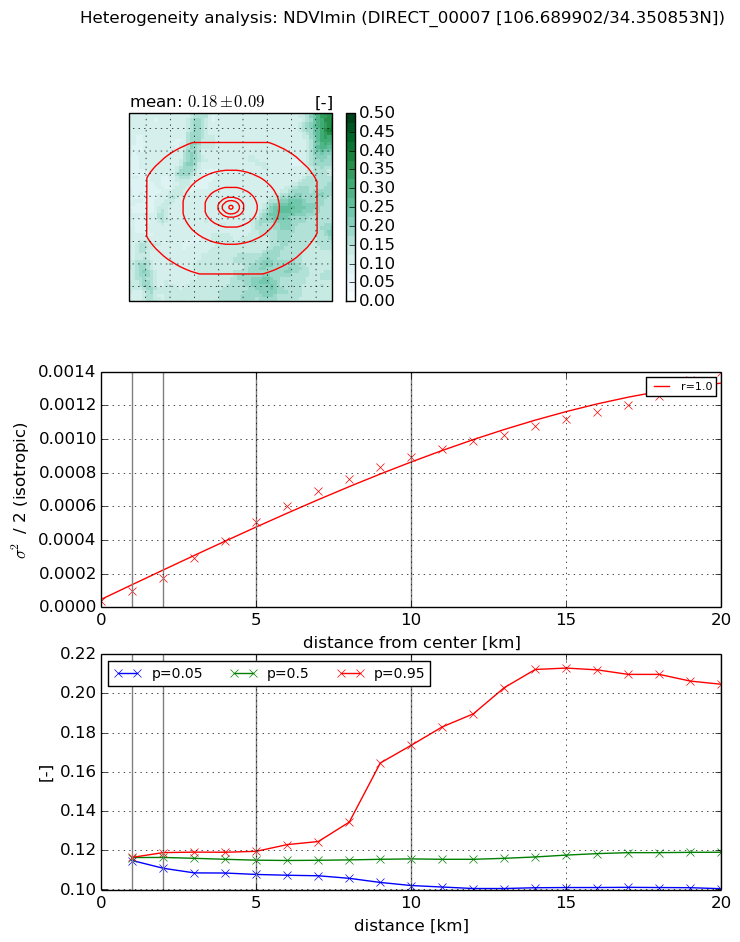
Heterogeneity analysis

The heterogeneity analysis provides information about the spatial and temporal heterogeneity of the site.

Topography


Roman et al. (2009) index


St

1.62586786992

Rcv

0.846952602815

Rse

0.0

Rst

-0.000757573650956

Rsv

-0.9974582136


Height range @ 1km [m]

16

Height range @ 2km [m]

31

Height range @ 5km [m]

89

Height range @ 10km [m]

-999

Height range @ 20km [m]

-999


Variance slope @ 1 km

93

Variance slope @ 2 km

105

Variance slope @ 5 km

167

Variance slope @ 10 km

-999

Variance slope @ 20 km

-999


NDVI (max. NDVI composite)


Roman et al. (2009) index


St

1.7983474344

Rcv

0.367414559096

Rse

0.0

Rst

-0.300783812703

Rsv

-0.999999854312


NDVI range @ 1km [-]

0.01

NDVI range @ 2km [-]

0.01

NDVI range @ 5km [-]

0.03

NDVI range @ 10km [-]

0.1

NDVI range @ 20km [-]

0.17


Variance slope @ 1 km

0.000488784657684

Variance slope @ 2 km

0.000505940206396

Variance slope @ 5 km

0.000521387048629

Variance slope @ 10 km

0.000288369822155

Variance slope @ 20 km

0.000147923139616


NDVI (min. NDVI composite)I


Roman et al. (2009) index


St

3.02235674148

Rcv

0.220270827952

Rse

0.0

Rst

0.0403409236774

Rsv

0.731991126392


NDVI range @ 1km [-]

0.0

NDVI range @ 2km [-]

0.01

NDVI range @ 5km [-]

0.01

NDVI range @ 10km [-]

0.07

NDVI range @ 20km [-]

0.1


NDVI slope @ 1 km

6.13206156994e-05

NDVI slope @ 2 km

6.90318625733e-05

NDVI slope @ 5 km

9.59499133971e-05

NDVI slope @ 10 km

9.07322666121e-05

NDVI slope @ 20 km

6.6290797321e-05


Temporal stability analysis

+000 deg (BHR)


BHR statistics

Temporal stability [1/decade]:


abs

rel


Weighted least square:

None


Ordinary least square:

None


Probabilities that GCOS criteria is met:

Weighted least square:

None %

Ordinary least square:

None %


DHR statistics

Temporal stability [1/decade]:


abs

rel


Weighted least square:

None


Ordinary least square:

None


Probabilities that GCOS criteria is met:

Weighted least square:

None %

Ordinary least square:

None %


+057/+063 deg (BHR)


BHR statistics

Temporal stability [1/decade]:


abs

rel


Weighted least square:

None


Ordinary least square:

None


Probabilities that GCOS criteria is met:

Weighted least square:

None %

Ordinary least square:

None %


DHR statistics

Temporal stability [1/decade]:


abs

rel


Weighted least square:

None


Ordinary least square:

None


Probabilities that GCOS criteria is met:

Weighted least square:

None %

Ordinary least square:

None %


Temporal anomaly analyis

The variance of the temporal anomalies provides an additional measure about the stability of the signal AFTER removal of the mean seasonal cylce.

+000 deg


+057/+063 deg