DIRECT_00044


Location

lon / lat [deg]: -93.751 / 41.9322

Source network: DIRECT


Geostationary surface albedo (GSA) data


“+000”


“+057/+063”


Landcover information (based on ESA CCI landcover data)


Landcover fractions @ 2km distance


Landcover fractions @ 20 km distance


Legend


Distance to open water bodies [km]:

9.44

Distance to urban areas [km]:

7.74


Radius: 1 km

Number of landcover classes:

1

Dominant landcover type:

10: cropland, rainfed

Fraction of dominant landcover type [%]:

100.0


Radius: 2 km

Number of landcover classes:

1

Dominant landcover type:

10: cropland, rainfed

Fraction of dominant landcover type [%]:

100.0


Radius: 5 km

Number of landcover classes:

2

Dominant landcover type:

10: cropland, rainfed

Fraction of dominant landcover type [%]:

99.0


Radius: 10 km

Number of landcover classes:

2

Dominant landcover type:

10: cropland, rainfed

Fraction of dominant landcover type [%]:

96.0


Radius: 20 km

Number of landcover classes:

7

Dominant landcover type:

10: cropland, rainfed

Fraction of dominant landcover type [%]:

81.0


Disturbances


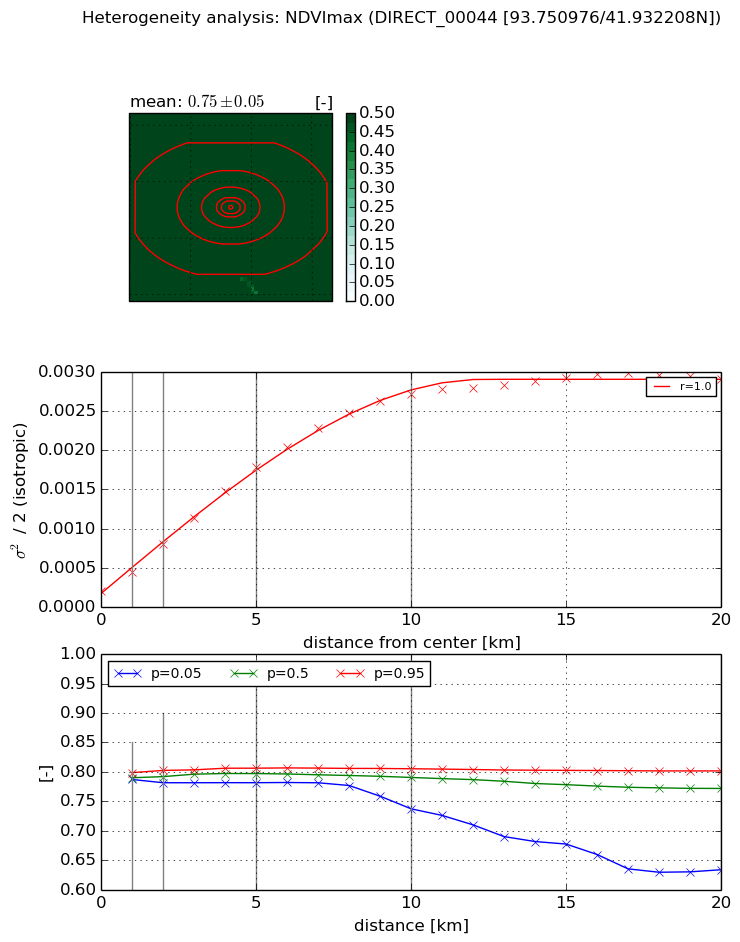
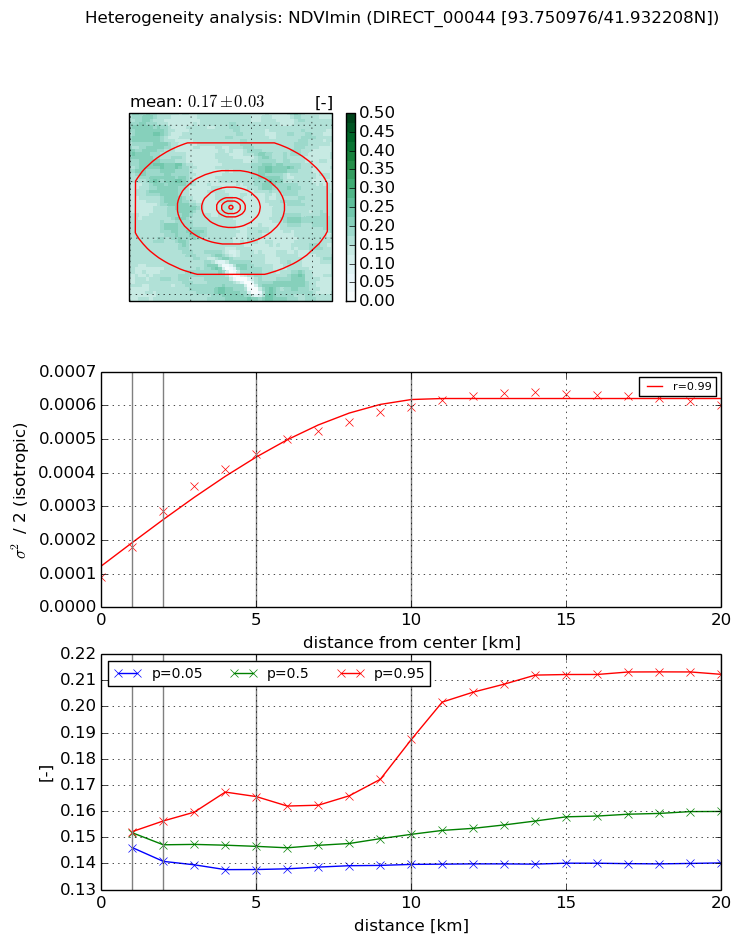
Heterogeneity analysis

The heterogeneity analysis provides information about the spatial and temporal heterogeneity of the site.

Topography


Roman et al. (2009) index


St

2.24624681842e-07

Rcv

0.202738594629

Rse

0.0

Rst

-0.0876308648647

Rsv

13355611.2809


Height range @ 1km [m]

7

Height range @ 2km [m]

7

Height range @ 5km [m]

13

Height range @ 10km [m]

-999

Height range @ 20km [m]

-999


Variance slope @ 1 km

6

Variance slope @ 2 km

5

Variance slope @ 5 km

3

Variance slope @ 10 km

-999

Variance slope @ 20 km

-999


NDVI (max. NDVI composite)


Roman et al. (2009) index


St

4.30938490253

Rcv

0.0398187376922

Rse

0.0

Rst

0.241526005953

Rsv

-0.4148102919


NDVI range @ 1km [-]

0.01

NDVI range @ 2km [-]

0.02

NDVI range @ 5km [-]

0.02

NDVI range @ 10km [-]

0.07

NDVI range @ 20km [-]

0.17


Variance slope @ 1 km

0.000241658967191

Variance slope @ 2 km

0.000295605086601

Variance slope @ 5 km

0.000322304337668

Variance slope @ 10 km

0.000264698338763

Variance slope @ 20 km

0.000129885025081


NDVI (min. NDVI composite)I


Roman et al. (2009) index


St

1.79602451858e-07

Rcv

0.16024607043

Rse

0.0

Rst

0.28243778692

Rsv

16703557.7157


NDVI range @ 1km [-]

0.01

NDVI range @ 2km [-]

0.02

NDVI range @ 5km [-]

0.03

NDVI range @ 10km [-]

0.05

NDVI range @ 20km [-]

0.07


NDVI slope @ 1 km

9.12174920611e-05

NDVI slope @ 2 km

9.80719448685e-05

NDVI slope @ 5 km

7.44278154691e-05

NDVI slope @ 10 km

4.87123852554e-05

NDVI slope @ 20 km

2.19690082091e-05


Temporal stability analysis

+000 deg (BHR)


BHR statistics

Temporal stability [1/decade]:


abs

rel


Weighted least square:

None


Ordinary least square:

None


Probabilities that GCOS criteria is met:

Weighted least square:

None %

Ordinary least square:

None %


DHR statistics

Temporal stability [1/decade]:


abs

rel


Weighted least square:

None


Ordinary least square:

None


Probabilities that GCOS criteria is met:

Weighted least square:

None %

Ordinary least square:

None %


+057/+063 deg (BHR)


BHR statistics

Temporal stability [1/decade]:


abs

rel


Weighted least square:

None


Ordinary least square:

None


Probabilities that GCOS criteria is met:

Weighted least square:

None %

Ordinary least square:

None %


DHR statistics

Temporal stability [1/decade]:


abs

rel


Weighted least square:

None


Ordinary least square:

None


Probabilities that GCOS criteria is met:

Weighted least square:

None %

Ordinary least square:

None %


Temporal anomaly analyis

The variance of the temporal anomalies provides an additional measure about the stability of the signal AFTER removal of the mean seasonal cylce.

+000 deg


+057/+063 deg