DIRECT_00056


Location

lon / lat [deg]: 13.2072 / 53.8925

Source network: DIRECT


Geostationary surface albedo (GSA) data


“+000”


“+057/+063”


Landcover information (based on ESA CCI landcover data)


Landcover fractions @ 2km distance


Landcover fractions @ 20 km distance


Legend


Distance to open water bodies [km]:

7.68

Distance to urban areas [km]:

1.5


Radius: 1 km

Number of landcover classes:

1

Dominant landcover type:

10: cropland, rainfed

Fraction of dominant landcover type [%]:

100.0


Radius: 2 km

Number of landcover classes:

3

Dominant landcover type:

10: cropland, rainfed

Fraction of dominant landcover type [%]:

95.0


Radius: 5 km

Number of landcover classes:

6

Dominant landcover type:

10: cropland, rainfed

Fraction of dominant landcover type [%]:

73.0


Radius: 10 km

Number of landcover classes:

6

Dominant landcover type:

10: cropland, rainfed

Fraction of dominant landcover type [%]:

75.0


Radius: 20 km

Number of landcover classes:

6

Dominant landcover type:

10: cropland, rainfed

Fraction of dominant landcover type [%]:

79.0


Disturbances


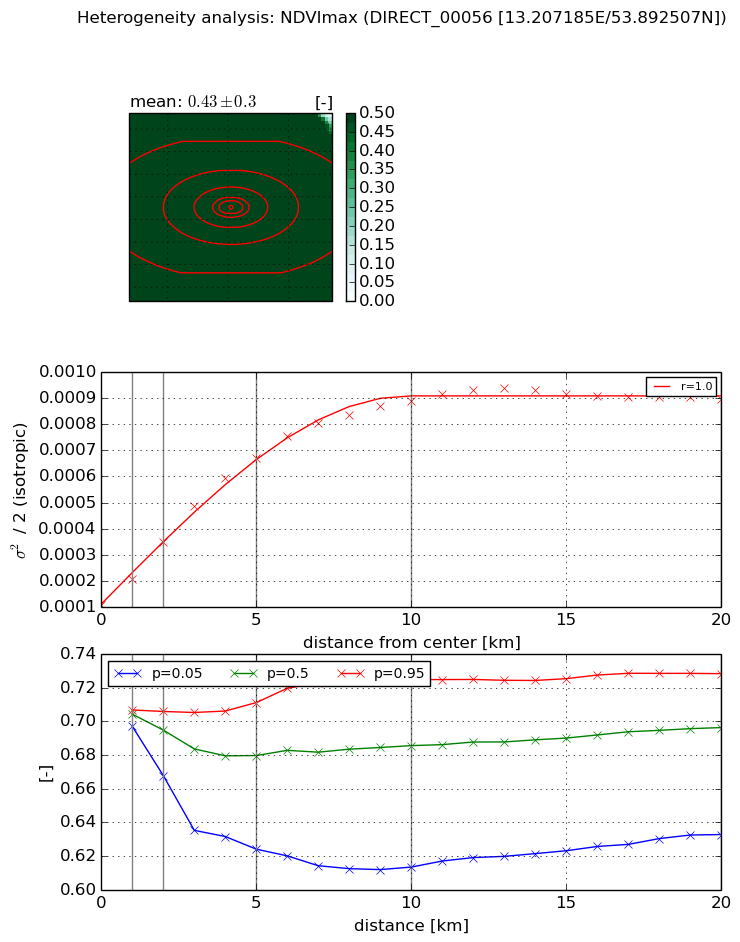
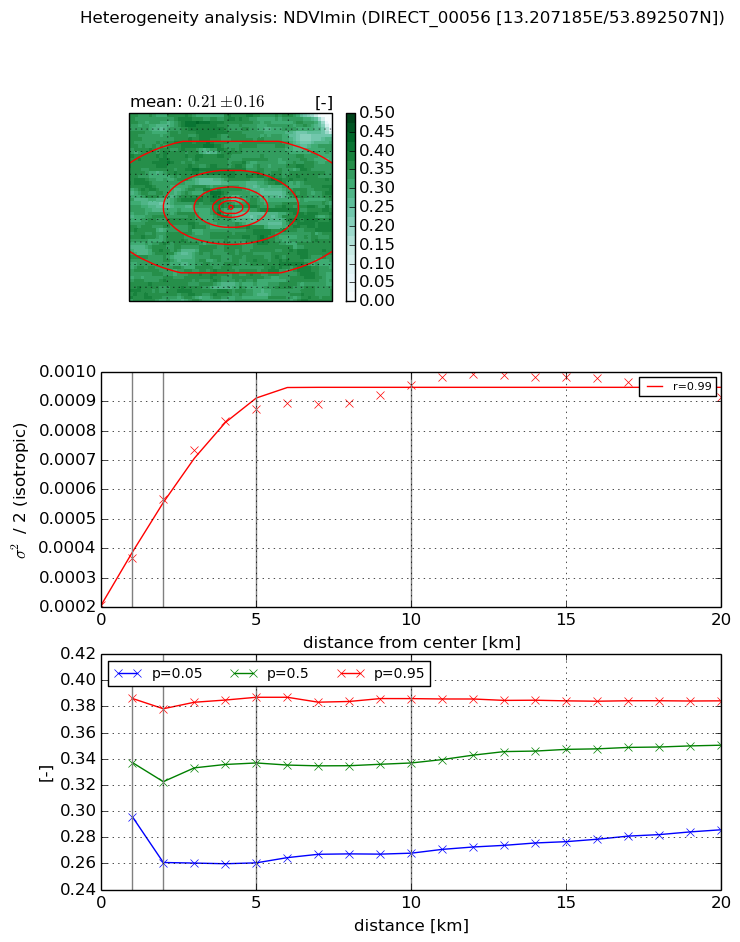
Heterogeneity analysis

The heterogeneity analysis provides information about the spatial and temporal heterogeneity of the site.

Topography


Roman et al. (2009) index


St

2.29420010954

Rcv

0.304246880659

Rse

0.0

Rst

-0.00340161747482

Rsv

-0.99999680601


Height range @ 1km [m]

5

Height range @ 2km [m]

12

Height range @ 5km [m]

18

Height range @ 10km [m]

-999

Height range @ 20km [m]

-999


Variance slope @ 1 km

27

Variance slope @ 2 km

15

Variance slope @ 5 km

6

Variance slope @ 10 km

-999

Variance slope @ 20 km

-999


NDVI (max. NDVI composite)


Roman et al. (2009) index


St

3.97320906663e-07

Rcv

0.284914336061

Rse

0.0

Rst

-0.0300942912878

Rsv

7550571.40094


NDVI range @ 1km [-]

0.01

NDVI range @ 2km [-]

0.04

NDVI range @ 5km [-]

0.09

NDVI range @ 10km [-]

0.11

NDVI range @ 20km [-]

0.1


Variance slope @ 1 km

9.79757365564e-05

Variance slope @ 2 km

0.000118867559954

Variance slope @ 5 km

0.000117209419699

Variance slope @ 10 km

7.99766822907e-05

Variance slope @ 20 km

3.36407986125e-05


NDVI (min. NDVI composite)I


Roman et al. (2009) index


St

3.69170830246

Rcv

-0.109708590098

Rse

0.0

Rst

0.35947960322

Rsv

-0.343443725082


NDVI range @ 1km [-]

0.09

NDVI range @ 2km [-]

0.12

NDVI range @ 5km [-]

0.13

NDVI range @ 10km [-]

0.12

NDVI range @ 20km [-]

0.1


NDVI slope @ 1 km

0.000162007616257

NDVI slope @ 2 km

0.000180775076496

NDVI slope @ 5 km

0.000139819077365

NDVI slope @ 10 km

6.63224382435e-05

NDVI slope @ 20 km

2.48741307393e-05


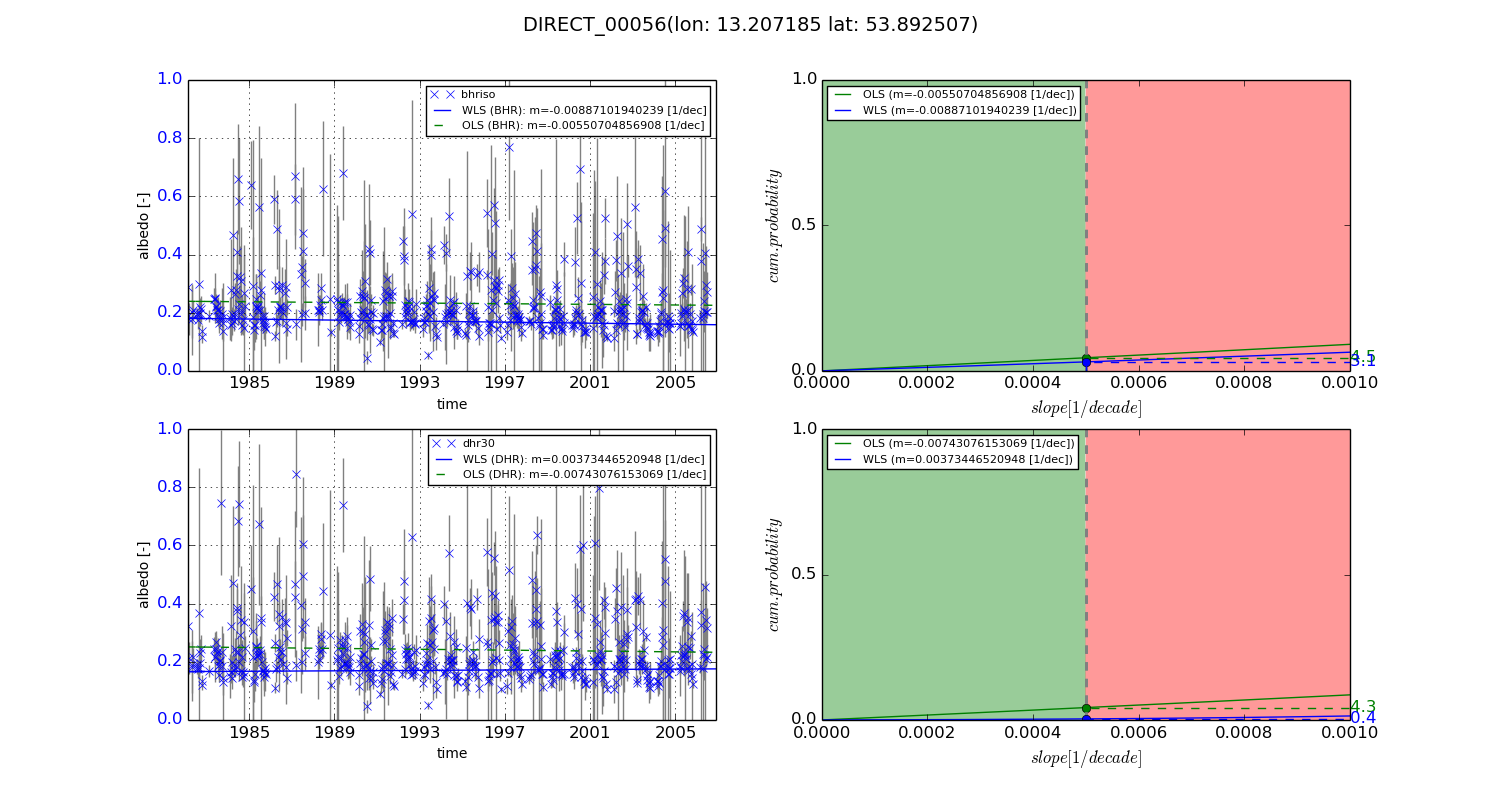
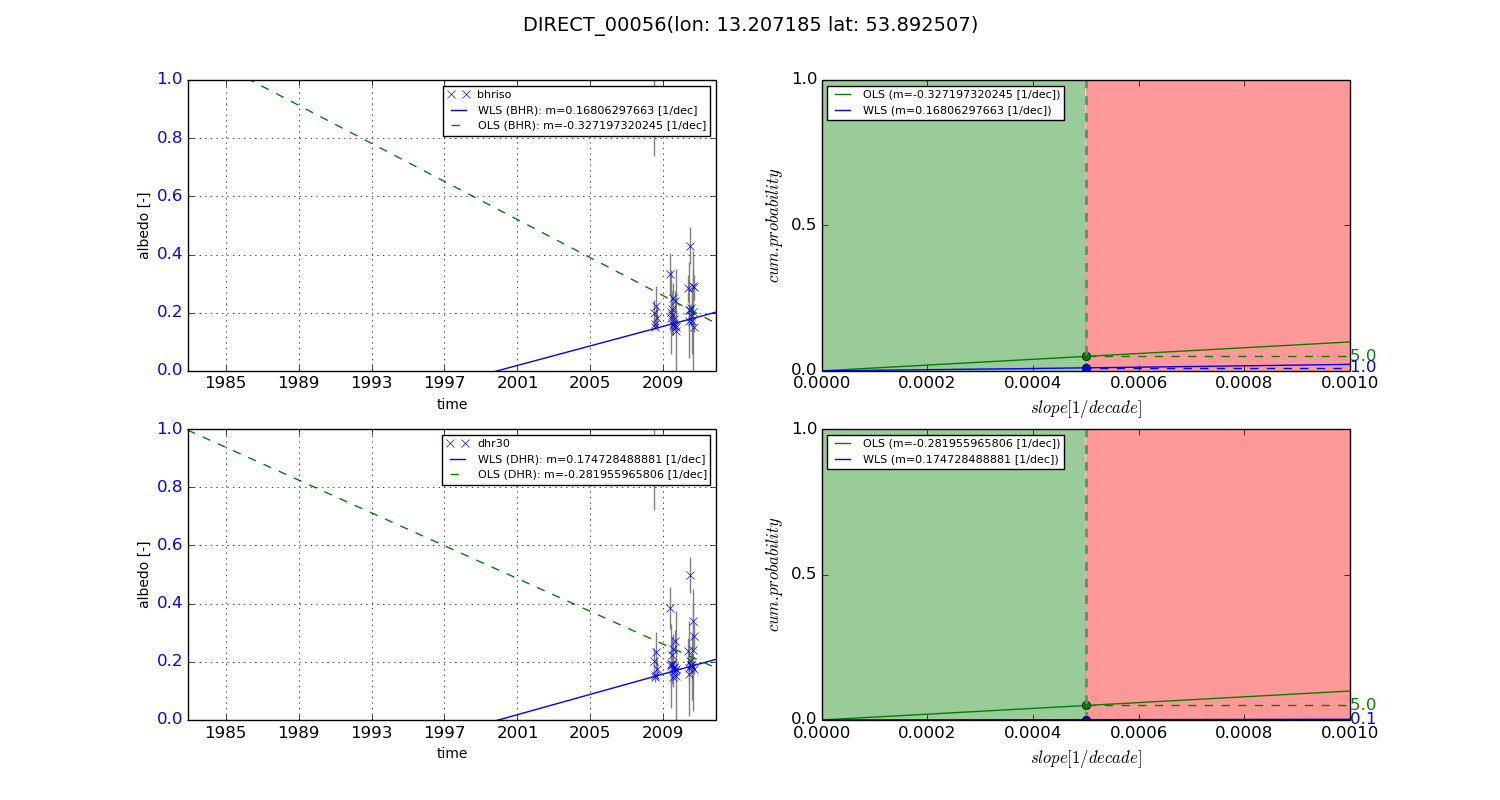
Temporal stability analysis

+000 deg (BHR)


BHR statistics

Temporal stability [1/decade]:


abs

rel


Weighted least square:

-0.00887101940239


Ordinary least square:

-0.00550704856908


Probabilities that GCOS criteria is met:

Weighted least square:

3.1 %

Ordinary least square:

4.5 %


DHR statistics

Temporal stability [1/decade]:


abs

rel


Weighted least square:

0.00373446520948


Ordinary least square:

-0.00743076153069


Probabilities that GCOS criteria is met:

Weighted least square:

0.4 %

Ordinary least square:

4.3 %


+057/+063 deg (BHR)


BHR statistics

Temporal stability [1/decade]:


abs

rel


Weighted least square:

0.16806297663


Ordinary least square:

-0.327197320245


Probabilities that GCOS criteria is met:

Weighted least square:

1.0 %

Ordinary least square:

5.0 %


DHR statistics

Temporal stability [1/decade]:


abs

rel


Weighted least square:

0.174728488881


Ordinary least square:

-0.281955965806


Probabilities that GCOS criteria is met:

Weighted least square:

0.1 %

Ordinary least square:

5.0 %


Temporal anomaly analyis

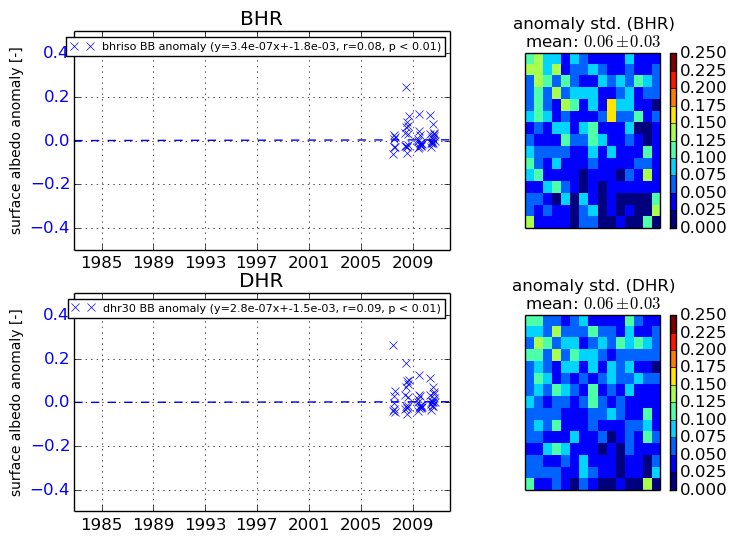
The variance of the temporal anomalies provides an additional measure about the stability of the signal AFTER removal of the mean seasonal cylce.
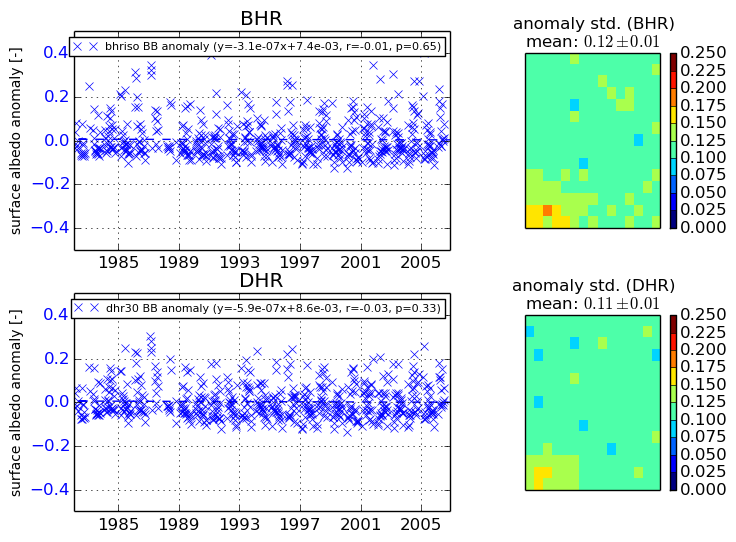
+000 deg


+057/+063 deg