DIRECT_00062


Location

lon / lat [deg]: 27.0116 / 62.644

Source network: DIRECT


Geostationary surface albedo (GSA) data


“+000”


“+057/+063”


Landcover information (based on ESA CCI landcover data)


Landcover fractions @ 2km distance


Landcover fractions @ 20 km distance


Legend


Distance to open water bodies [km]:

2.25

Distance to urban areas [km]:

1.76


Radius: 1 km

Number of landcover classes:

2

Dominant landcover type:

70: Tree cover, needleleaved, evergreen, closed to open (>15%)

Fraction of dominant landcover type [%]:

97.0


Radius: 2 km

Number of landcover classes:

5

Dominant landcover type:

70: Tree cover, needleleaved, evergreen, closed to open (>15%)

Fraction of dominant landcover type [%]:

84.0


Radius: 5 km

Number of landcover classes:

6

Dominant landcover type:

70: Tree cover, needleleaved, evergreen, closed to open (>15%)

Fraction of dominant landcover type [%]:

56.0


Radius: 10 km

Number of landcover classes:

8

Dominant landcover type:

70: Tree cover, needleleaved, evergreen, closed to open (>15%)

Fraction of dominant landcover type [%]:

60.0


Radius: 20 km

Number of landcover classes:

7

Dominant landcover type:

70: Tree cover, needleleaved, evergreen, closed to open (>15%)

Fraction of dominant landcover type [%]:

62.0


Disturbances


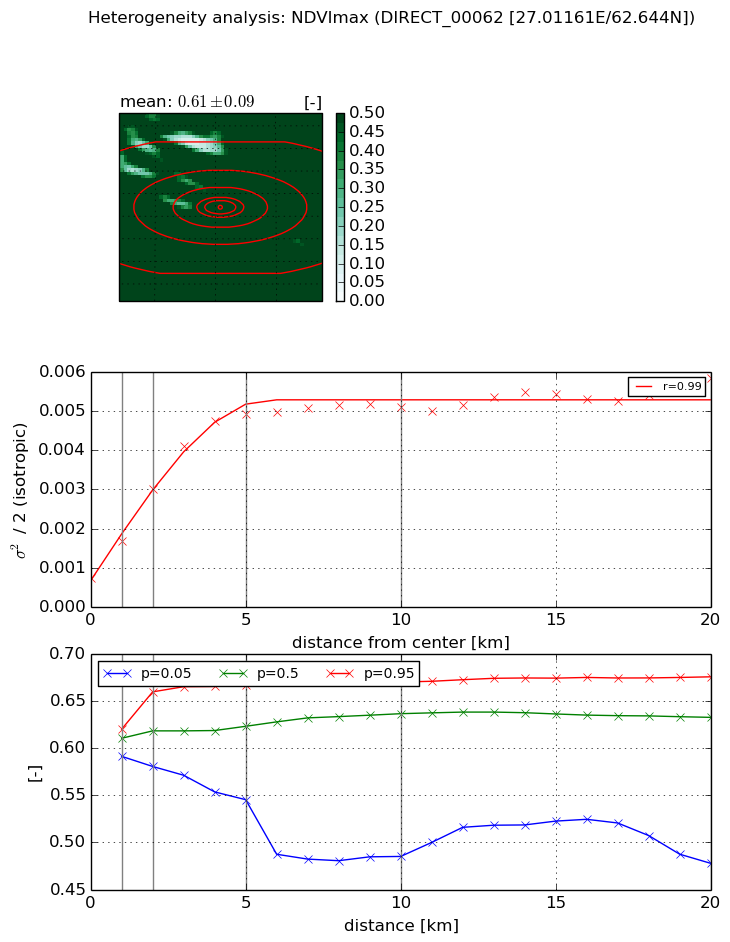
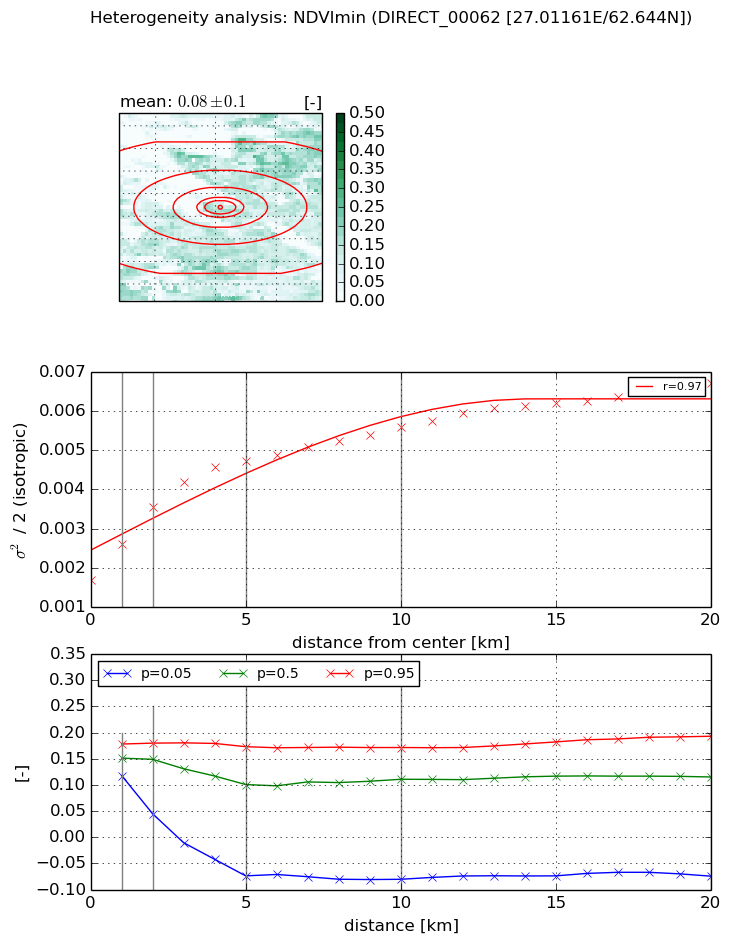
Heterogeneity analysis

The heterogeneity analysis provides information about the spatial and temporal heterogeneity of the site.

Topography


Roman et al. (2009) index


St

2.54865508982

Rcv

0.798932419136

Rse

0.0

Rst

-0.033226314883

Rsv

-0.344932670769


Height range @ 1km [m]

21

Height range @ 2km [m]

26

Height range @ 5km [m]

62

Height range @ 10km [m]

-999

Height range @ 20km [m]

-999


Variance slope @ 1 km

128

Variance slope @ 2 km

118

Variance slope @ 5 km

60

Variance slope @ 10 km

-999

Variance slope @ 20 km

-999


NDVI (max. NDVI composite)


Roman et al. (2009) index


St

0.894407435757

Rcv

0.809247944509

Rse

0.0

Rst

-0.301193021027

Rsv

2.24373508451


NDVI range @ 1km [-]

0.03

NDVI range @ 2km [-]

0.08

NDVI range @ 5km [-]

0.12

NDVI range @ 10km [-]

0.19

NDVI range @ 20km [-]

0.2


Variance slope @ 1 km

0.000933525302845

Variance slope @ 2 km

0.00113603533539

Variance slope @ 5 km

0.000891122948076

Variance slope @ 10 km

0.000402313871388

Variance slope @ 20 km

0.00015914722204


NDVI (min. NDVI composite)I


Roman et al. (2009) index


St

1.29167831196

Rcv

0.711487764688

Rse

0.0

Rst

-0.237339886654

Rsv

1.37373205429


NDVI range @ 1km [-]

0.06

NDVI range @ 2km [-]

0.14

NDVI range @ 5km [-]

0.25

NDVI range @ 10km [-]

0.25

NDVI range @ 20km [-]

0.27


NDVI slope @ 1 km

0.000904188449292

NDVI slope @ 2 km

0.000933024225072

NDVI slope @ 5 km

0.000621063799155

NDVI slope @ 10 km

0.000343368458509

NDVI slope @ 20 km

0.000197257715033


Temporal stability analysis

+000 deg (BHR)


BHR statistics

Temporal stability [1/decade]:


abs

rel


Weighted least square:

-99999.0


Ordinary least square:

-99999.0


Probabilities that GCOS criteria is met:

Weighted least square:

-99999.0 %

Ordinary least square:

-99999.0 %


DHR statistics

Temporal stability [1/decade]:


abs

rel


Weighted least square:

-99999.0


Ordinary least square:

-99999.0


Probabilities that GCOS criteria is met:

Weighted least square:

-99999.0 %

Ordinary least square:

-99999.0 %


+057/+063 deg (BHR)


BHR statistics

Temporal stability [1/decade]:


abs

rel


Weighted least square:

-99999.0


Ordinary least square:

-99999.0


Probabilities that GCOS criteria is met:

Weighted least square:

-99999.0 %

Ordinary least square:

-99999.0 %


DHR statistics

Temporal stability [1/decade]:


abs

rel


Weighted least square:

-99999.0


Ordinary least square:

-99999.0


Probabilities that GCOS criteria is met:

Weighted least square:

-99999.0 %

Ordinary least square:

-99999.0 %


Temporal anomaly analyis

The variance of the temporal anomalies provides an additional measure about the stability of the signal AFTER removal of the mean seasonal cylce.

+000 deg


+057/+063 deg