DIRECT_00067


Location

lon / lat [deg]: 3.123 / 43.9375

Source network: DIRECT


Geostationary surface albedo (GSA) data


“+000”


“+057/+063”


Landcover information (based on ESA CCI landcover data)


Landcover fractions @ 2km distance


Landcover fractions @ 20 km distance


Legend


Distance to open water bodies [km]:

15.98

Distance to urban areas [km]:

7.01


Radius: 1 km

Number of landcover classes:

5

Dominant landcover type:

10: cropland, rainfed

Fraction of dominant landcover type [%]:

43.0


Radius: 2 km

Number of landcover classes:

5

Dominant landcover type:

130: grassland

Fraction of dominant landcover type [%]:

42.0


Radius: 5 km

Number of landcover classes:

7

Dominant landcover type:

130: grassland

Fraction of dominant landcover type [%]:

50.0


Radius: 10 km

Number of landcover classes:

8

Dominant landcover type:

10: cropland, rainfed

Fraction of dominant landcover type [%]:

40.0


Radius: 20 km

Number of landcover classes:

8

Dominant landcover type:

10: cropland, rainfed

Fraction of dominant landcover type [%]:

35.0


Disturbances


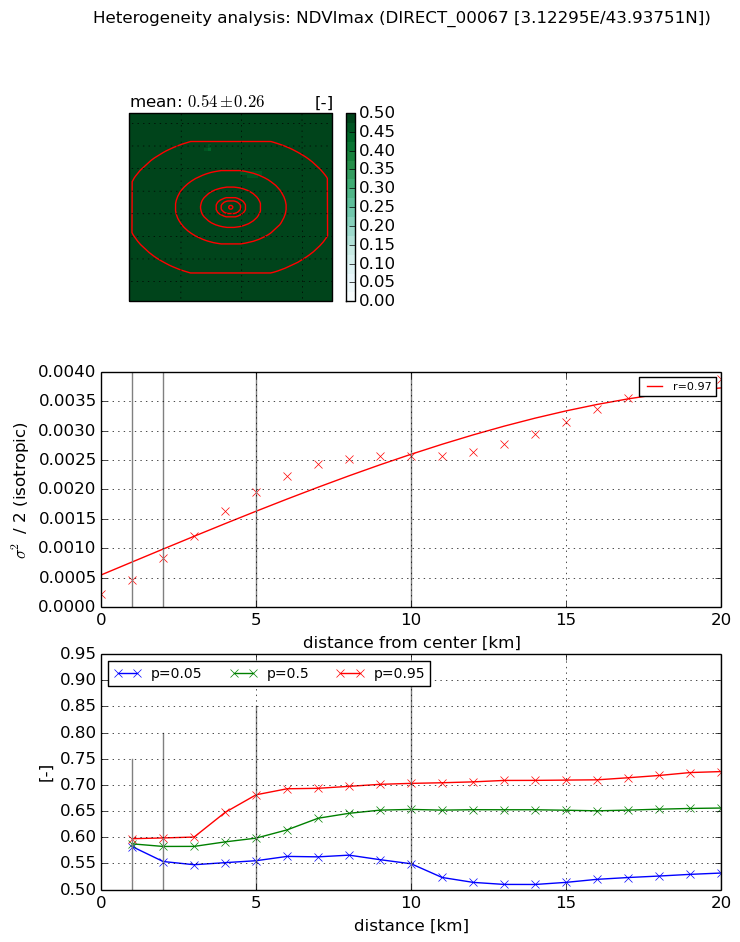
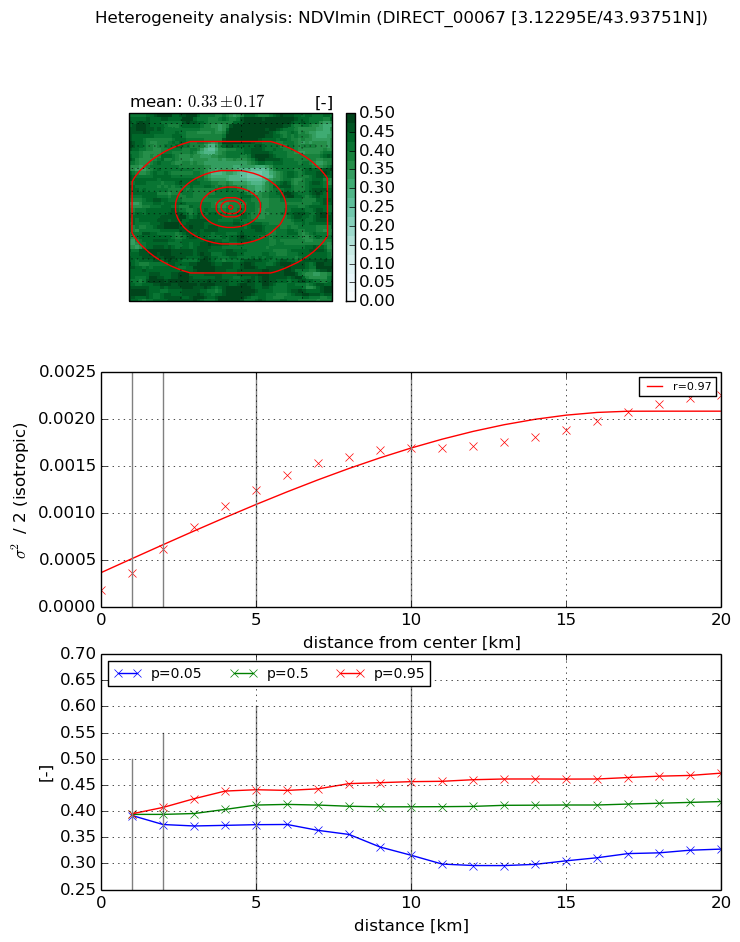
Heterogeneity analysis

The heterogeneity analysis provides information about the spatial and temporal heterogeneity of the site.

Topography


Roman et al. (2009) index


St

1.43480103511

Rcv

1.85762253498

Rse

0.0

Rst

-0.121037950265

Rsv

0.112221753185


Height range @ 1km [m]

46

Height range @ 2km [m]

85

Height range @ 5km [m]

253

Height range @ 10km [m]

-999

Height range @ 20km [m]

-999


Variance slope @ 1 km

2426

Variance slope @ 2 km

2534

Variance slope @ 5 km

1569

Variance slope @ 10 km

-999

Variance slope @ 20 km

-999


NDVI (max. NDVI composite)


Roman et al. (2009) index


St

1.65307548143

Rcv

1.25590220511

Rse

0.0

Rst

-0.0987216992453

Rsv

0.4601752586


NDVI range @ 1km [-]

0.02

NDVI range @ 2km [-]

0.05

NDVI range @ 5km [-]

0.13

NDVI range @ 10km [-]

0.15

NDVI range @ 20km [-]

0.19


Variance slope @ 1 km

0.000238988036761

Variance slope @ 2 km

0.000304603042488

Variance slope @ 5 km

0.000358798095167

Variance slope @ 10 km

0.00025615281341

Variance slope @ 20 km

0.000164258546391


NDVI (min. NDVI composite)I


Roman et al. (2009) index


St

5.12135841335

Rcv

0.107481009201

Rse

0.0

Rst

0.227009536199

Rsv

-0.251291537763


NDVI range @ 1km [-]

0.0

NDVI range @ 2km [-]

0.03

NDVI range @ 5km [-]

0.07

NDVI range @ 10km [-]

0.14

NDVI range @ 20km [-]

0.15


NDVI slope @ 1 km

0.000181113708243

NDVI slope @ 2 km

0.000218065107183

NDVI slope @ 5 km

0.000219717528606

NDVI slope @ 10 km

0.000158262370383

NDVI slope @ 20 km

9.03192822196e-05


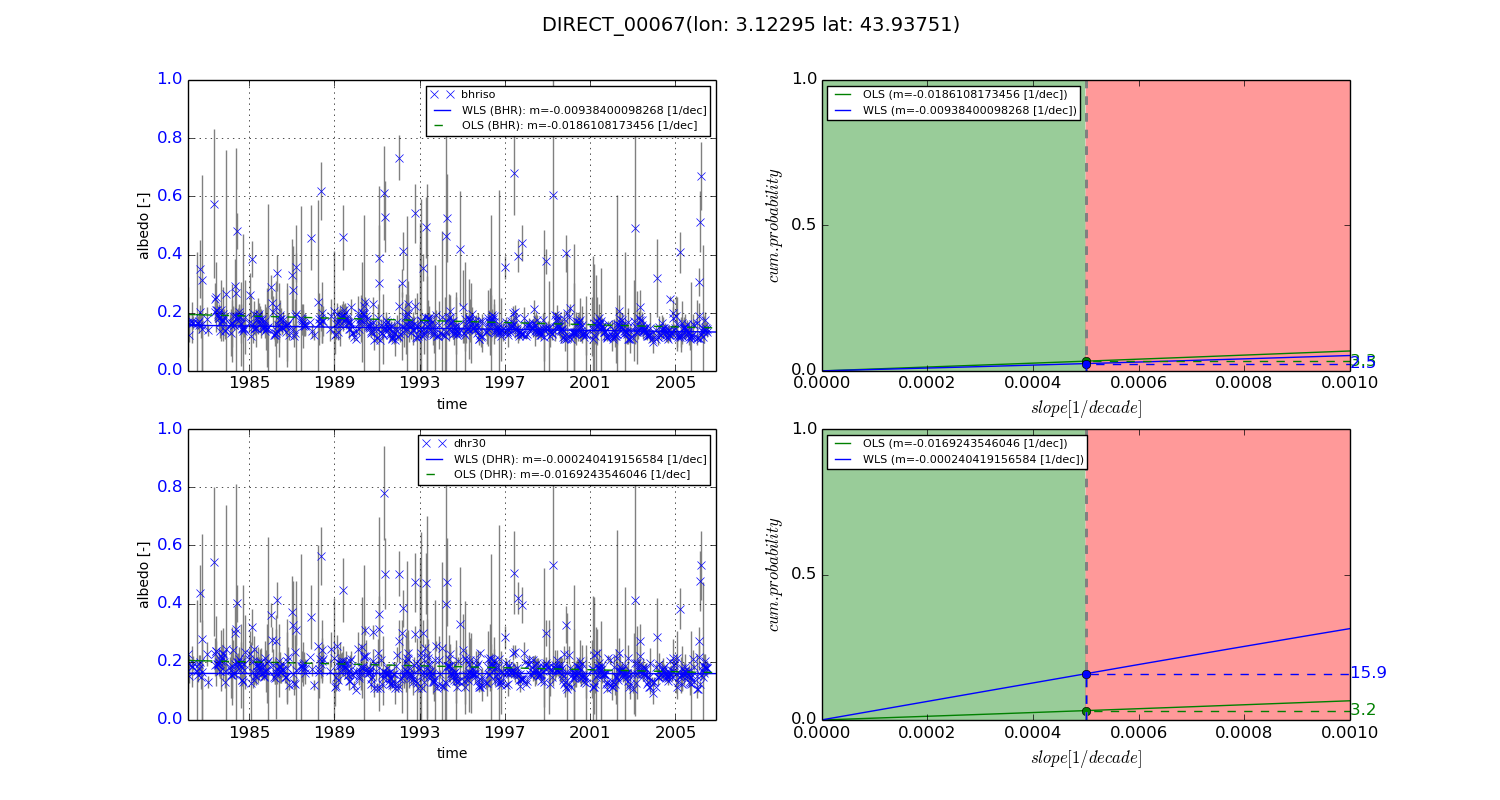
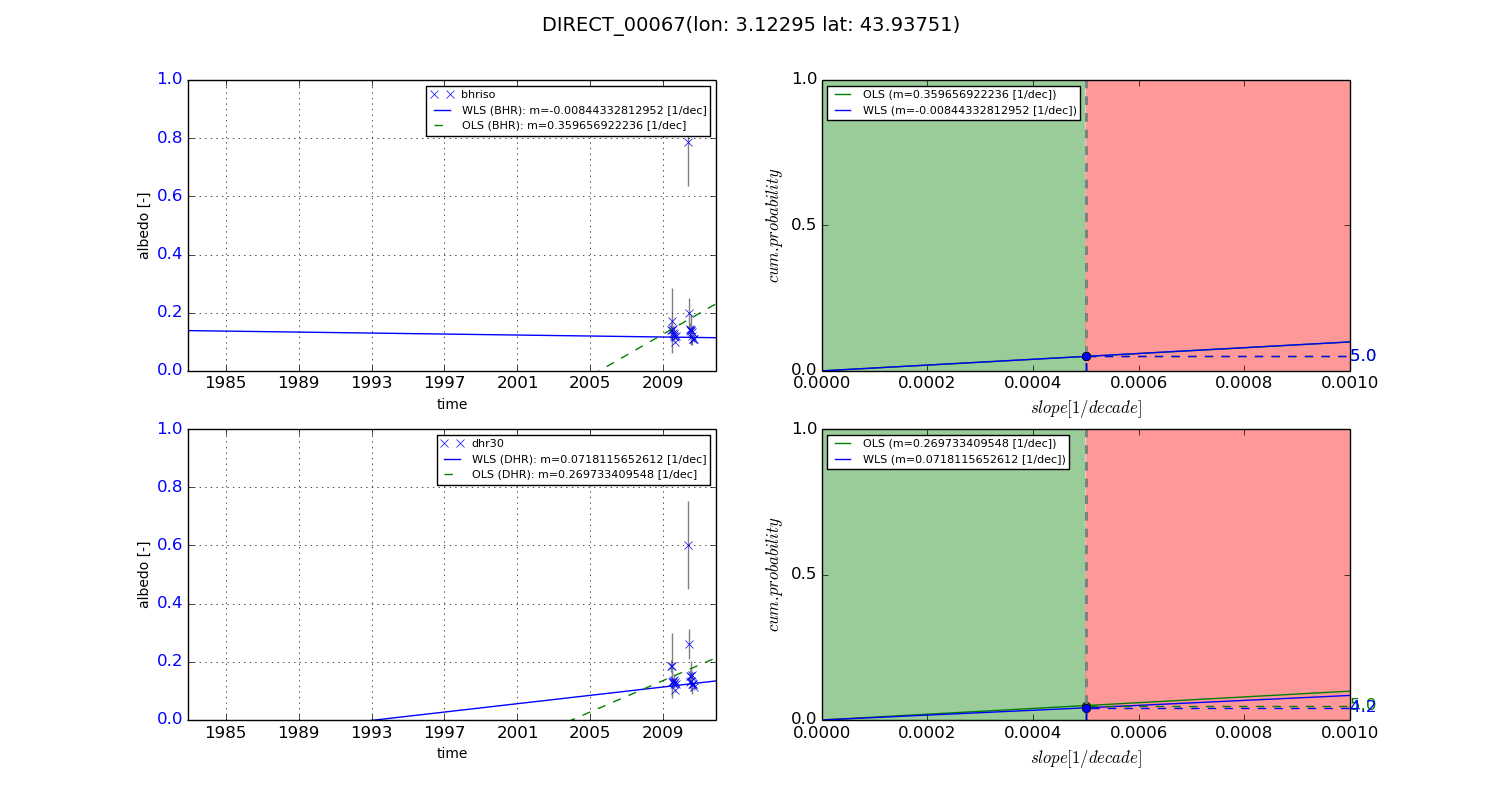
Temporal stability analysis

+000 deg (BHR)


BHR statistics

Temporal stability [1/decade]:


abs

rel


Weighted least square:

-0.00938400098268


Ordinary least square:

-0.0186108173456


Probabilities that GCOS criteria is met:

Weighted least square:

2.5 %

Ordinary least square:

3.3 %


DHR statistics

Temporal stability [1/decade]:


abs

rel


Weighted least square:

-0.000240419156584


Ordinary least square:

-0.0169243546046


Probabilities that GCOS criteria is met:

Weighted least square:

15.9 %

Ordinary least square:

3.2 %


+057/+063 deg (BHR)


BHR statistics

Temporal stability [1/decade]:


abs

rel


Weighted least square:

-0.00844332812952


Ordinary least square:

0.359656922236


Probabilities that GCOS criteria is met:

Weighted least square:

5.0 %

Ordinary least square:

5.0 %


DHR statistics

Temporal stability [1/decade]:


abs

rel


Weighted least square:

0.0718115652612


Ordinary least square:

0.269733409548


Probabilities that GCOS criteria is met:

Weighted least square:

4.2 %

Ordinary least square:

5.0 %


Temporal anomaly analyis

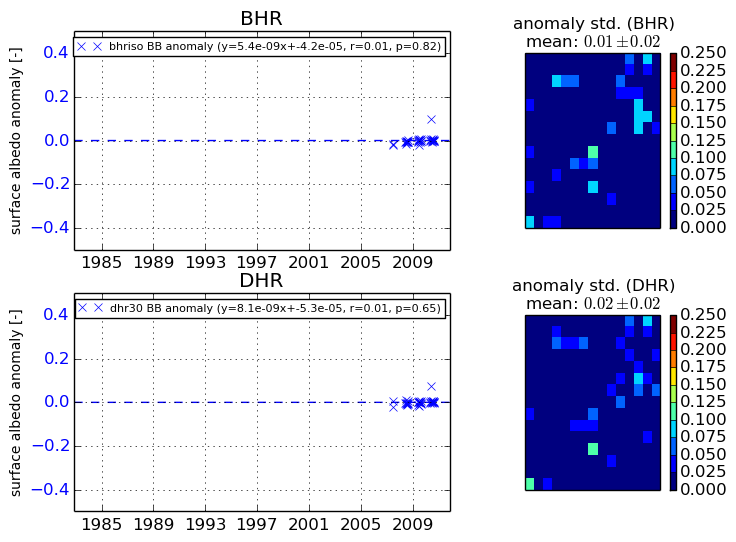
The variance of the temporal anomalies provides an additional measure about the stability of the signal AFTER removal of the mean seasonal cylce.
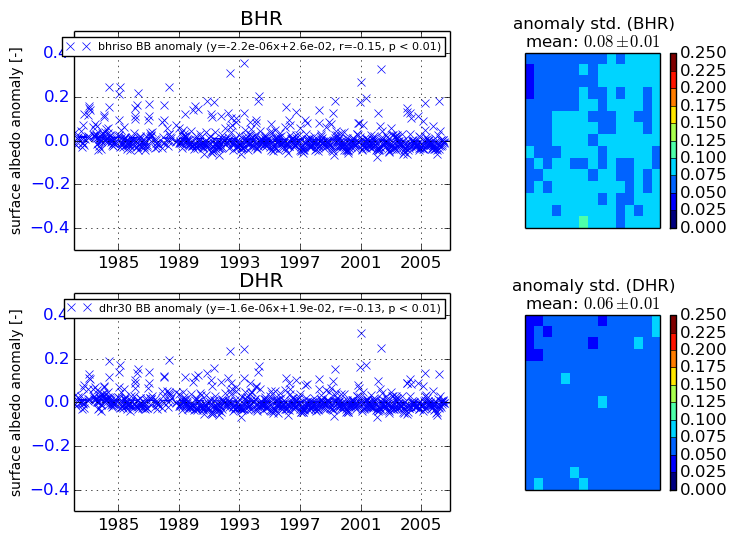
+000 deg


+057/+063 deg