DIRECT_00079


Location

lon / lat [deg]: -1.4306 / 51.164

Source network: DIRECT


Geostationary surface albedo (GSA) data


“+000”


“+057/+063”


Landcover information (based on ESA CCI landcover data)


Landcover fractions @ 2km distance


Landcover fractions @ 20 km distance


Legend


Distance to open water bodies [km]:

27.6

Distance to urban areas [km]:

1.04


Radius: 1 km

Number of landcover classes:

2

Dominant landcover type:

10: cropland, rainfed

Fraction of dominant landcover type [%]:

53.0


Radius: 2 km

Number of landcover classes:

3

Dominant landcover type:

10: cropland, rainfed

Fraction of dominant landcover type [%]:

68.0


Radius: 5 km

Number of landcover classes:

5

Dominant landcover type:

10: cropland, rainfed

Fraction of dominant landcover type [%]:

71.0


Radius: 10 km

Number of landcover classes:

4

Dominant landcover type:

10: cropland, rainfed

Fraction of dominant landcover type [%]:

80.0


Radius: 20 km

Number of landcover classes:

4

Dominant landcover type:

10: cropland, rainfed

Fraction of dominant landcover type [%]:

72.0


Disturbances


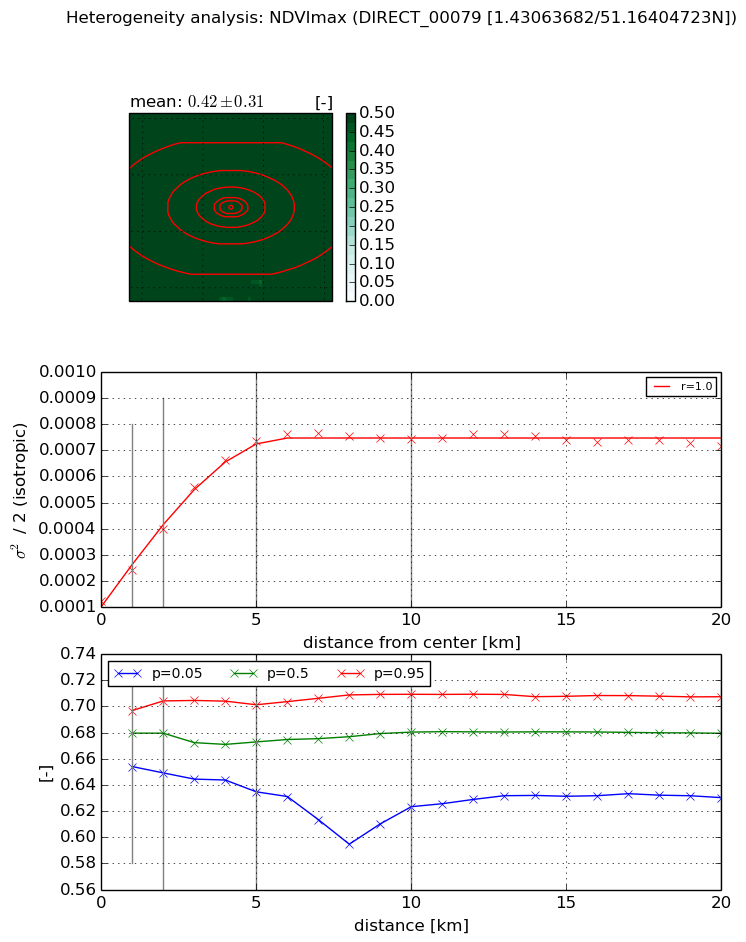
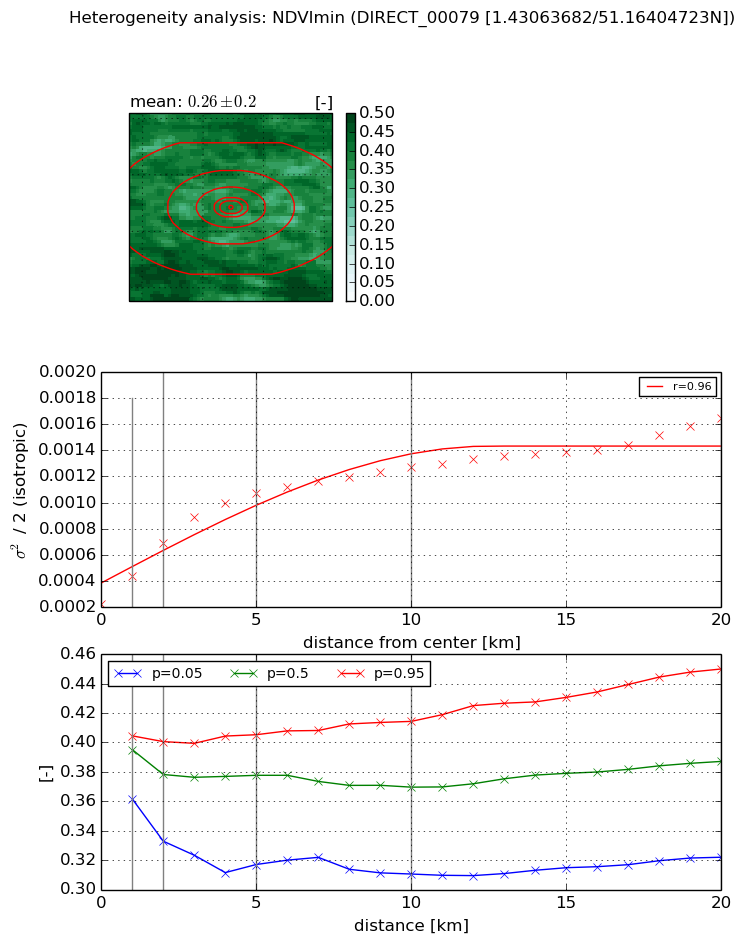
Heterogeneity analysis

The heterogeneity analysis provides information about the spatial and temporal heterogeneity of the site.

Topography


Roman et al. (2009) index


St

2.95481666678

Rcv

0.0214567261803

Rse

0.0

Rst

-0.103536082477

Rsv

0.890298608142


Height range @ 1km [m]

24

Height range @ 2km [m]

47

Height range @ 5km [m]

65

Height range @ 10km [m]

-999

Height range @ 20km [m]

-999


Variance slope @ 1 km

176

Variance slope @ 2 km

140

Variance slope @ 5 km

92

Variance slope @ 10 km

-999

Variance slope @ 20 km

-999


NDVI (max. NDVI composite)


Roman et al. (2009) index


St

nan

Rcv

nan

Rse

nan

Rst

nan

Rsv

nan


NDVI range @ 1km [-]

0.04

NDVI range @ 2km [-]

0.06

NDVI range @ 5km [-]

0.07

NDVI range @ 10km [-]

0.09

NDVI range @ 20km [-]

0.08


Variance slope @ 1 km

0.000117765326733

Variance slope @ 2 km

0.000137467376935

Variance slope @ 5 km

0.000128267648741

Variance slope @ 10 km

6.09343873393e-05

Variance slope @ 20 km

1.90508606567e-05


NDVI (min. NDVI composite)I


Roman et al. (2009) index


St

4.94737131755

Rcv

0.107710739729

Rse

0.0

Rst

0.156930665076

Rsv

-0.341741218905


NDVI range @ 1km [-]

0.04

NDVI range @ 2km [-]

0.07

NDVI range @ 5km [-]

0.09

NDVI range @ 10km [-]

0.1

NDVI range @ 20km [-]

0.13


NDVI slope @ 1 km

0.000214328691291

NDVI slope @ 2 km

0.000230646741794

NDVI slope @ 5 km

0.000174237834171

NDVI slope @ 10 km

9.61925970644e-05

NDVI slope @ 20 km

5.31567338154e-05


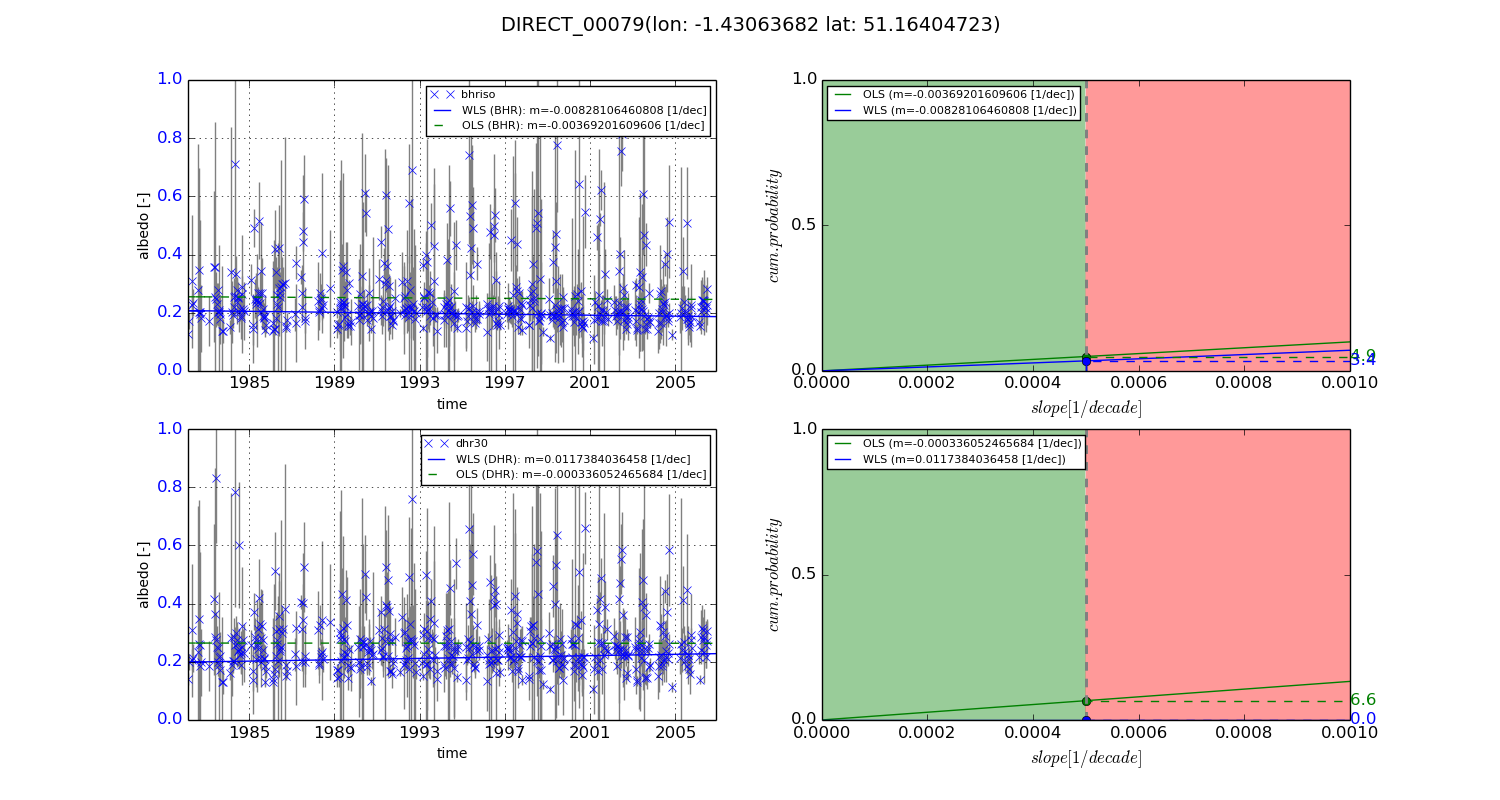
Temporal stability analysis

+000 deg (BHR)


BHR statistics

Temporal stability [1/decade]:


abs

rel


Weighted least square:

-0.00828106460808


Ordinary least square:

-0.00369201609606


Probabilities that GCOS criteria is met:

Weighted least square:

3.4 %

Ordinary least square:

4.9 %


DHR statistics

Temporal stability [1/decade]:


abs

rel


Weighted least square:

0.0117384036458


Ordinary least square:

-0.000336052465684


Probabilities that GCOS criteria is met:

Weighted least square:

0.0 %

Ordinary least square:

6.6 %


+057/+063 deg (BHR)


BHR statistics

Temporal stability [1/decade]:


abs

rel


Weighted least square:

-99999.0


Ordinary least square:

-99999.0


Probabilities that GCOS criteria is met:

Weighted least square:

-99999.0 %

Ordinary least square:

-99999.0 %


DHR statistics

Temporal stability [1/decade]:


abs

rel


Weighted least square:

-99999.0


Ordinary least square:

-99999.0


Probabilities that GCOS criteria is met:

Weighted least square:

-99999.0 %

Ordinary least square:

-99999.0 %


Temporal anomaly analyis

The variance of the temporal anomalies provides an additional measure about the stability of the signal AFTER removal of the mean seasonal cylce.
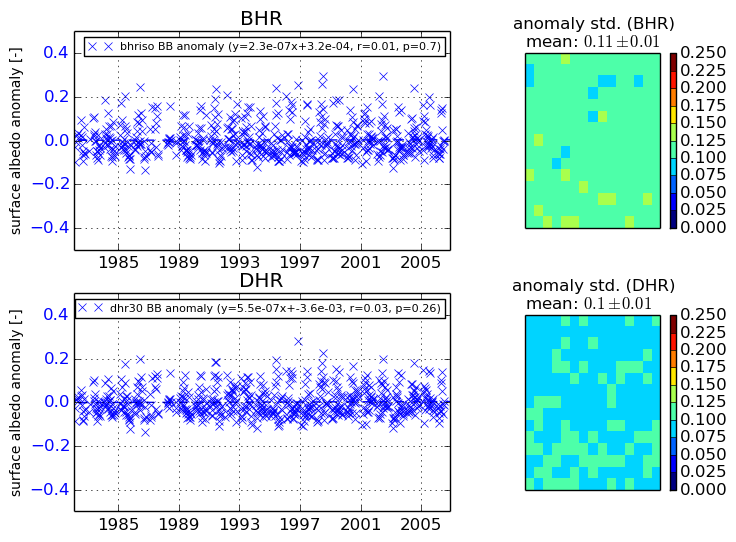
+000 deg


+057/+063 deg