DIRECT_00086


Location

lon / lat [deg]: -15.4335 / 15.4119

Source network: DIRECT


Geostationary surface albedo (GSA) data


“+000”


“+057/+063”


Landcover information (based on ESA CCI landcover data)


Landcover fractions @ 2km distance


Landcover fractions @ 20 km distance


Legend


Distance to open water bodies [km]:

30.81

Distance to urban areas [km]:

7.85


Radius: 1 km

Number of landcover classes:

2

Dominant landcover type:

12: cropland, tree or shrub cover

Fraction of dominant landcover type [%]:

69.0


Radius: 2 km

Number of landcover classes:

3

Dominant landcover type:

100: Mosaic tree and shrub (>50%) / herbaceous cover (<50%)

Fraction of dominant landcover type [%]:

50.0


Radius: 5 km

Number of landcover classes:

3

Dominant landcover type:

100: Mosaic tree and shrub (>50%) / herbaceous cover (<50%)

Fraction of dominant landcover type [%]:

63.0


Radius: 10 km

Number of landcover classes:

3

Dominant landcover type:

100: Mosaic tree and shrub (>50%) / herbaceous cover (<50%)

Fraction of dominant landcover type [%]:

66.0


Radius: 20 km

Number of landcover classes:

4

Dominant landcover type:

100: Mosaic tree and shrub (>50%) / herbaceous cover (<50%)

Fraction of dominant landcover type [%]:

54.0


Disturbances


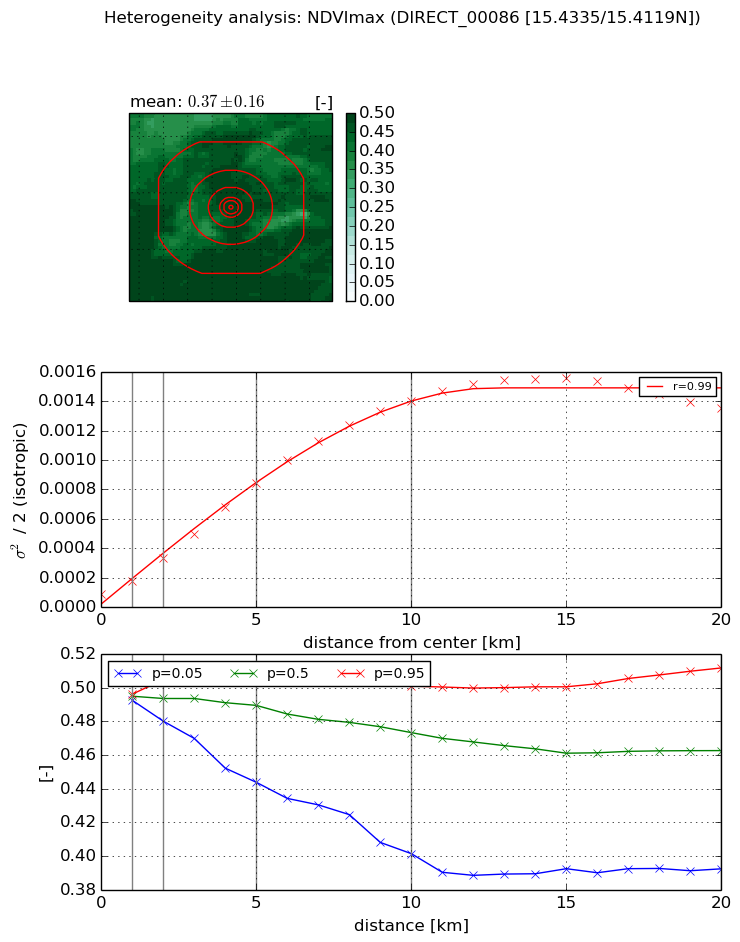
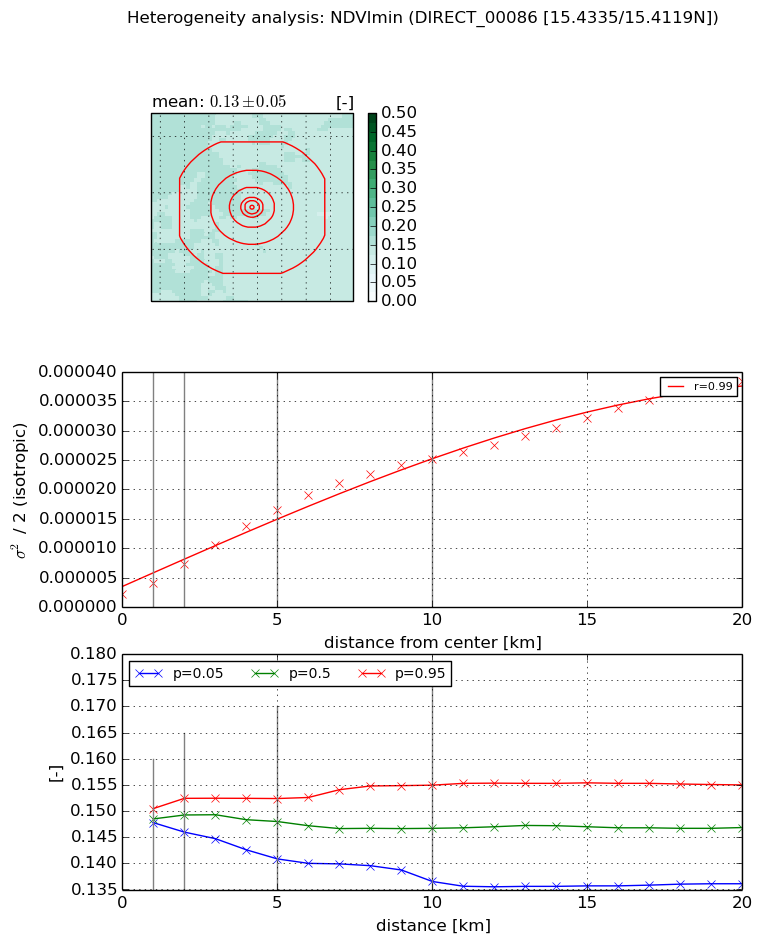
Heterogeneity analysis

The heterogeneity analysis provides information about the spatial and temporal heterogeneity of the site.

Topography


Roman et al. (2009) index


St

12.2770644608

Rcv

0.103427295367

Rse

0.0

Rst

-0.0481482180911

Rsv

0.0927825747148


Height range @ 1km [m]

5

Height range @ 2km [m]

10

Height range @ 5km [m]

13

Height range @ 10km [m]

-999

Height range @ 20km [m]

-999


Variance slope @ 1 km

4

Variance slope @ 2 km

4

Variance slope @ 5 km

3

Variance slope @ 10 km

-999

Variance slope @ 20 km

-999


NDVI (max. NDVI composite)


Roman et al. (2009) index


St

7.00760103317e-10

Rcv

0.783593183429

Rse

0.0

Rst

0.253598231845

Rsv

4281065638.69


NDVI range @ 1km [-]

0.0

NDVI range @ 2km [-]

0.02

NDVI range @ 5km [-]

0.07

NDVI range @ 10km [-]

0.1

NDVI range @ 20km [-]

0.12


Variance slope @ 1 km

8.6204364598e-05

Variance slope @ 2 km

0.000121560390008

Variance slope @ 5 km

0.000156286049539

Variance slope @ 10 km

0.000140875797194

Variance slope @ 20 km

6.80467383521e-05


NDVI (min. NDVI composite)I


Roman et al. (2009) index


St

4.98561408403

Rcv

0.47171530584

Rse

0.0

Rst

-0.023472231218

Rsv

0.1065437541


NDVI range @ 1km [-]

0.0

NDVI range @ 2km [-]

0.01

NDVI range @ 5km [-]

0.01

NDVI range @ 10km [-]

0.02

NDVI range @ 20km [-]

0.02


NDVI slope @ 1 km

1.93228841837e-06

NDVI slope @ 2 km

2.61053593618e-06

NDVI slope @ 5 km

2.97596385582e-06

NDVI slope @ 10 km

2.4274818191e-06

NDVI slope @ 20 km

1.75712748994e-06


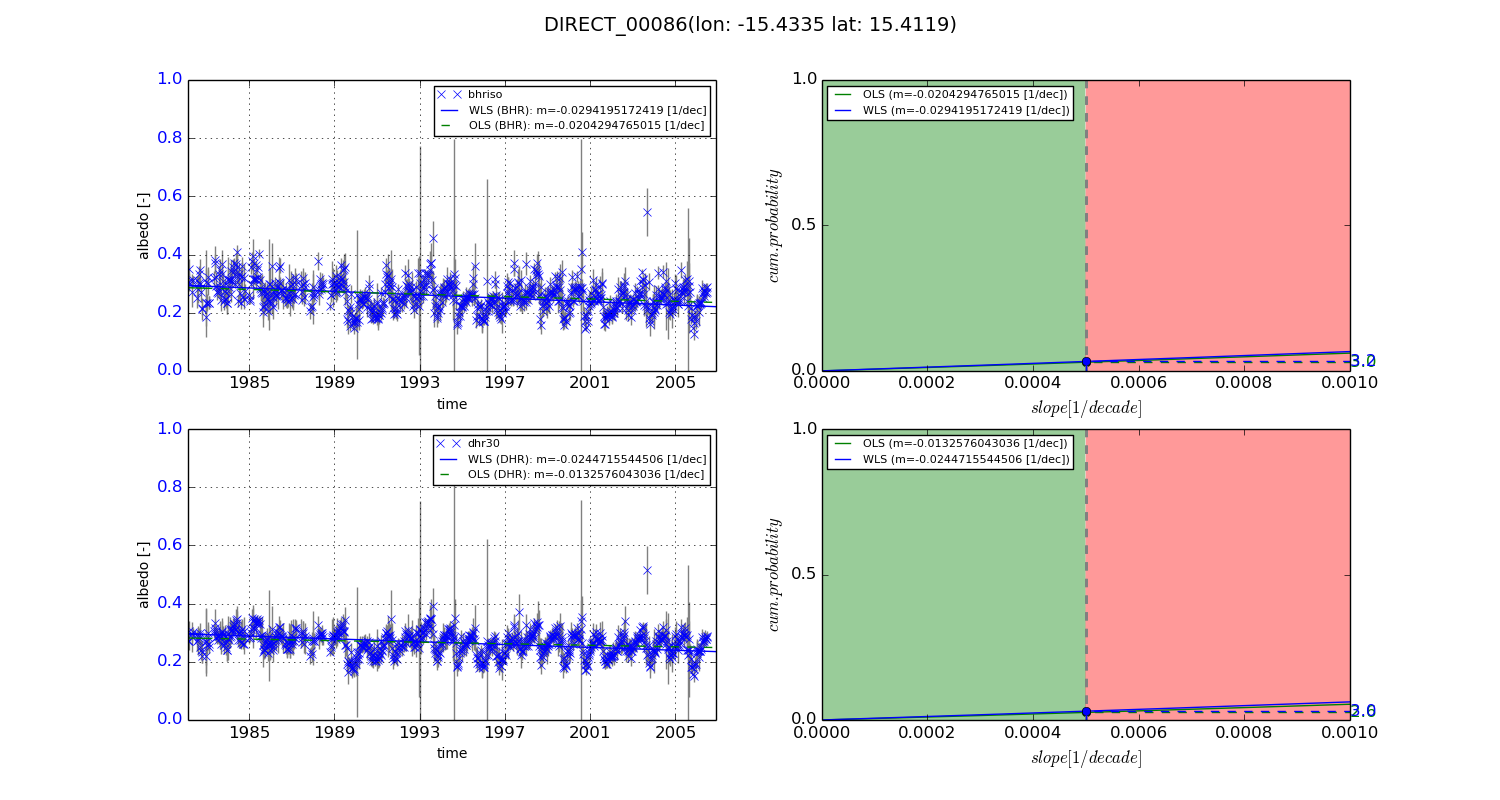
Temporal stability analysis

+000 deg (BHR)


BHR statistics

Temporal stability [1/decade]:


abs

rel


Weighted least square:

-0.0294195172419


Ordinary least square:

-0.0204294765015


Probabilities that GCOS criteria is met:

Weighted least square:

3.2 %

Ordinary least square:

3.0 %


DHR statistics

Temporal stability [1/decade]:


abs

rel


Weighted least square:

-0.0244715544506


Ordinary least square:

-0.0132576043036


Probabilities that GCOS criteria is met:

Weighted least square:

3.0 %

Ordinary least square:

2.6 %


+057/+063 deg (BHR)


BHR statistics

Temporal stability [1/decade]:


abs

rel


Weighted least square:

-99999.0


Ordinary least square:

-99999.0


Probabilities that GCOS criteria is met:

Weighted least square:

-99999.0 %

Ordinary least square:

-99999.0 %


DHR statistics

Temporal stability [1/decade]:


abs

rel


Weighted least square:

-99999.0


Ordinary least square:

-99999.0


Probabilities that GCOS criteria is met:

Weighted least square:

-99999.0 %

Ordinary least square:

-99999.0 %


Temporal anomaly analyis

The variance of the temporal anomalies provides an additional measure about the stability of the signal AFTER removal of the mean seasonal cylce.
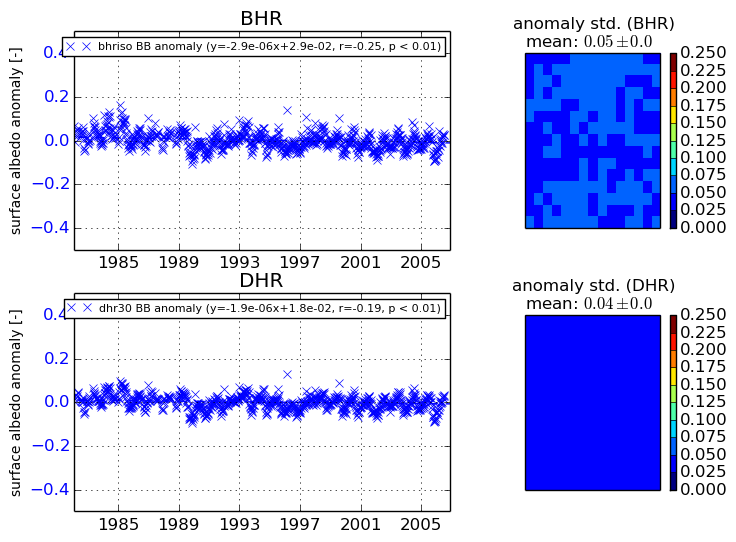
+000 deg


+057/+063 deg