DIRECT_00092


Location

lon / lat [deg]: 31.4318 / 1.6909

Source network: DIRECT


Geostationary surface albedo (GSA) data


“+000”


“+057/+063”


Landcover information (based on ESA CCI landcover data)


Landcover fractions @ 2km distance


Landcover fractions @ 20 km distance


Legend


Distance to open water bodies [km]:

12.92

Distance to urban areas [km]:

29.51


Radius: 1 km

Number of landcover classes:

1

Dominant landcover type:

50: Tree cover, broadleaved, evergreen, closed to open (>15%)

Fraction of dominant landcover type [%]:

100.0


Radius: 2 km

Number of landcover classes:

2

Dominant landcover type:

50: Tree cover, broadleaved, evergreen, closed to open (>15%)

Fraction of dominant landcover type [%]:

98.0


Radius: 5 km

Number of landcover classes:

4

Dominant landcover type:

50: Tree cover, broadleaved, evergreen, closed to open (>15%)

Fraction of dominant landcover type [%]:

66.0


Radius: 10 km

Number of landcover classes:

3

Dominant landcover type:

10: cropland, rainfed

Fraction of dominant landcover type [%]:

61.0


Radius: 20 km

Number of landcover classes:

6

Dominant landcover type:

10: cropland, rainfed

Fraction of dominant landcover type [%]:

60.0


Disturbances


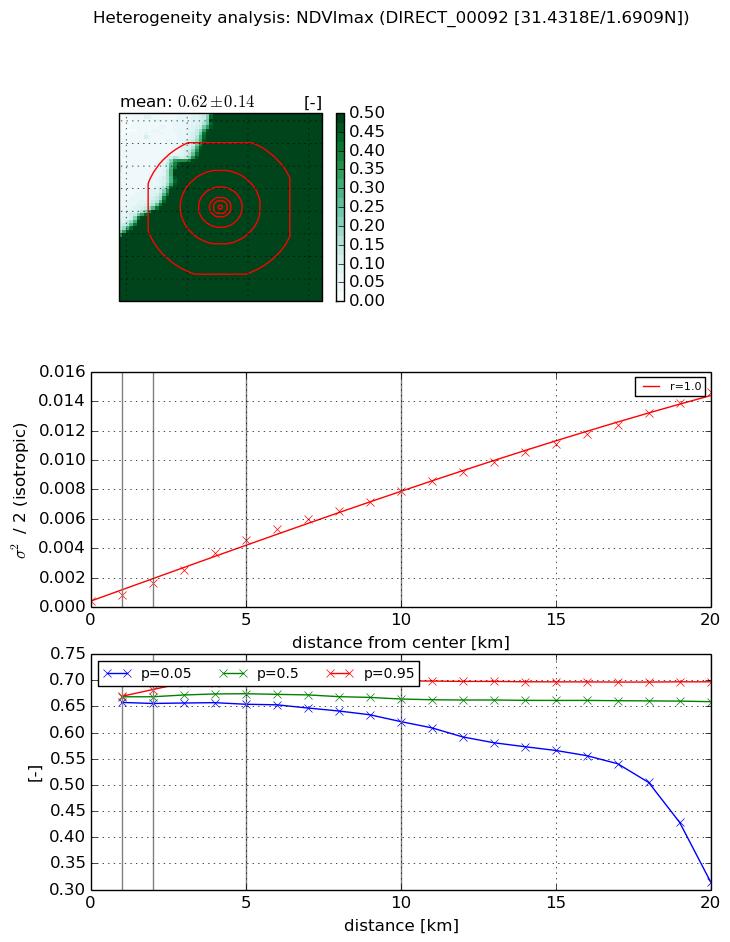
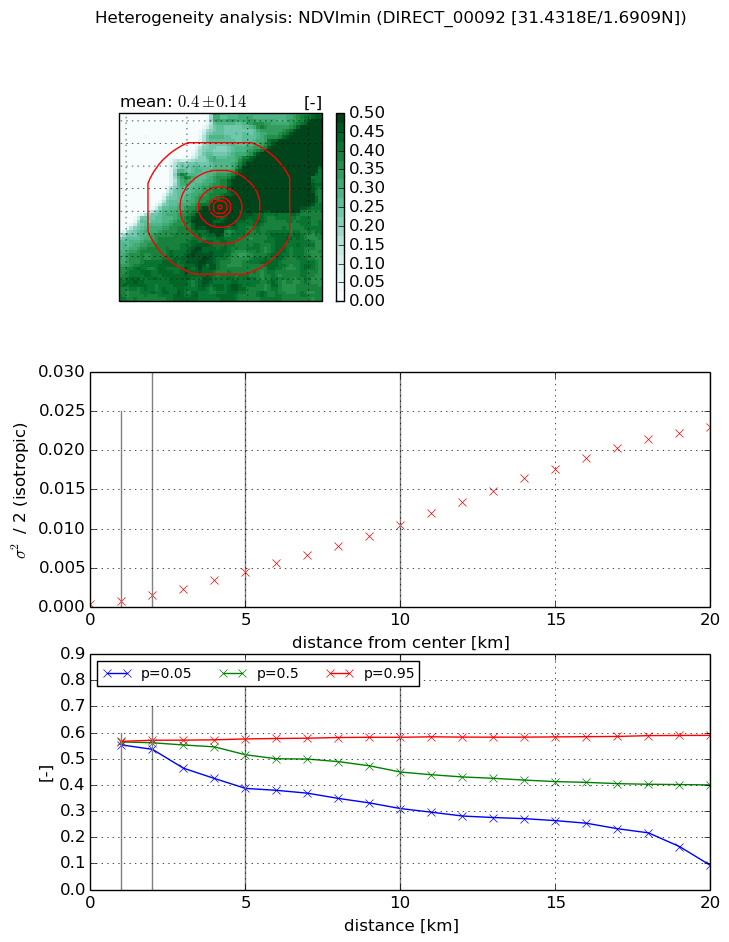
Heterogeneity analysis

The heterogeneity analysis provides information about the spatial and temporal heterogeneity of the site.

Topography


Roman et al. (2009) index


St

14.0961733561

Rcv

0.111592307349

Rse

0.0

Rst

-0.0160760735954

Rsv

-0.0851553354079


Height range @ 1km [m]

44

Height range @ 2km [m]

48

Height range @ 5km [m]

105

Height range @ 10km [m]

-999

Height range @ 20km [m]

-999


Variance slope @ 1 km

401

Variance slope @ 2 km

337

Variance slope @ 5 km

238

Variance slope @ 10 km

-999

Variance slope @ 20 km

-999


NDVI (max. NDVI composite)


Roman et al. (2009) index


St

3.51459773676

Rcv

0.0343780722447

Rse

0.0

Rst

0.411748675029

Rsv

-0.407456002359


NDVI range @ 1km [-]

0.01

NDVI range @ 2km [-]

0.03

NDVI range @ 5km [-]

0.04

NDVI range @ 10km [-]

0.08

NDVI range @ 20km [-]

0.38


Variance slope @ 1 km

0.000419195485289

Variance slope @ 2 km

0.000623356954413

Variance slope @ 5 km

0.000861721326286

Variance slope @ 10 km

0.000777937776595

Variance slope @ 20 km

0.000704209530716


NDVI (min. NDVI composite)I


Roman et al. (2009) index


St

1.84365824528

Rcv

0.874816329332

Rse

0.0

Rst

-0.0692677893068

Rsv

0.683115503462


NDVI range @ 1km [-]

0.01

NDVI range @ 2km [-]

0.03

NDVI range @ 5km [-]

0.19

NDVI range @ 10km [-]

0.27

NDVI range @ 20km [-]

0.5


NDVI slope @ 1 km

0.000389756217614

NDVI slope @ 2 km

0.000574002449276

NDVI slope @ 5 km

0.000848721083754

NDVI slope @ 10 km

0.00103409084932

NDVI slope @ 20 km

0.00122531961082


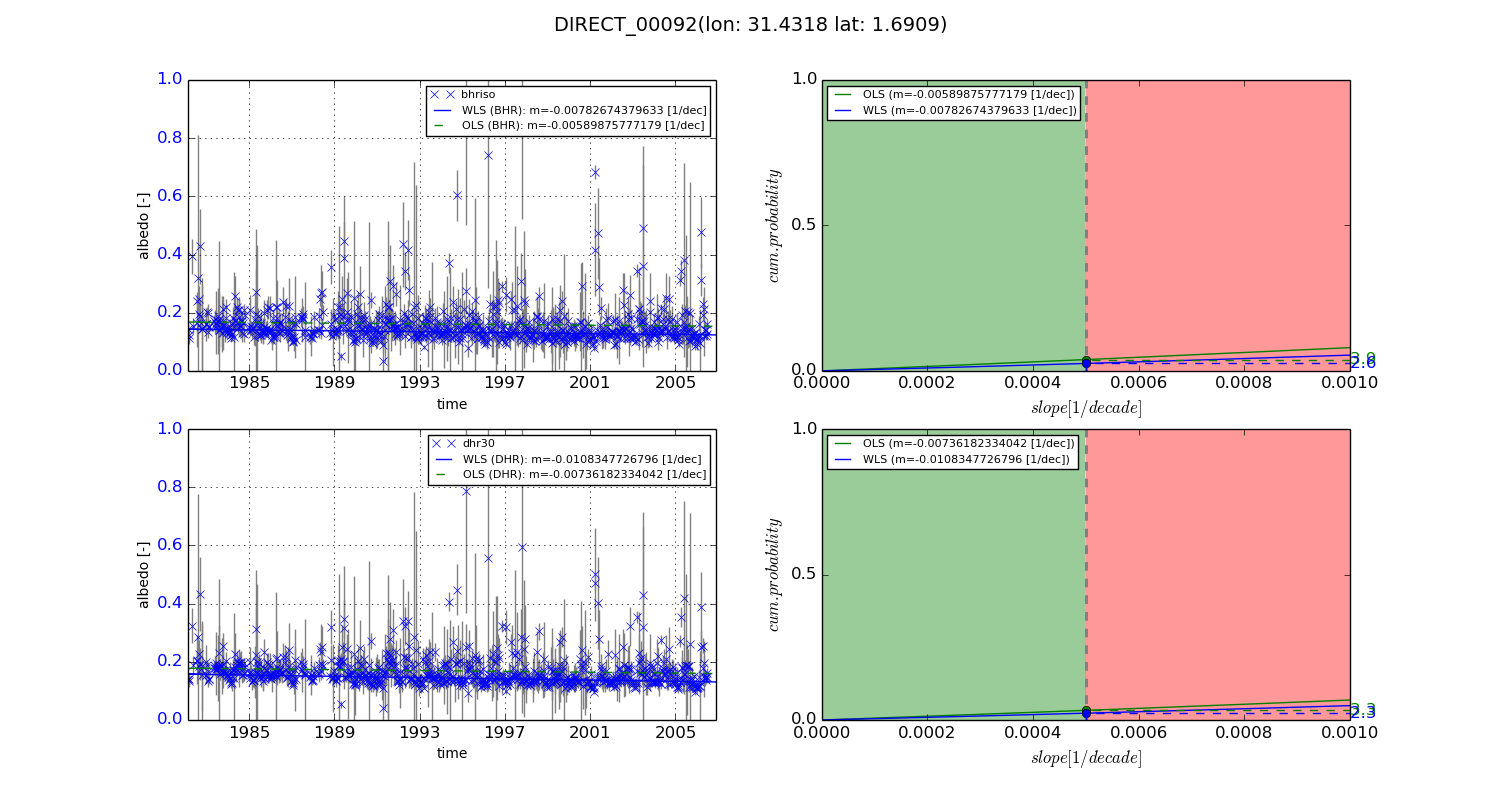
Temporal stability analysis

+000 deg (BHR)


BHR statistics

Temporal stability [1/decade]:


abs

rel


Weighted least square:

-0.00782674379633


Ordinary least square:

-0.00589875777179


Probabilities that GCOS criteria is met:

Weighted least square:

2.6 %

Ordinary least square:

3.9 %


DHR statistics

Temporal stability [1/decade]:


abs

rel


Weighted least square:

-0.0108347726796


Ordinary least square:

-0.00736182334042


Probabilities that GCOS criteria is met:

Weighted least square:

2.3 %

Ordinary least square:

3.3 %


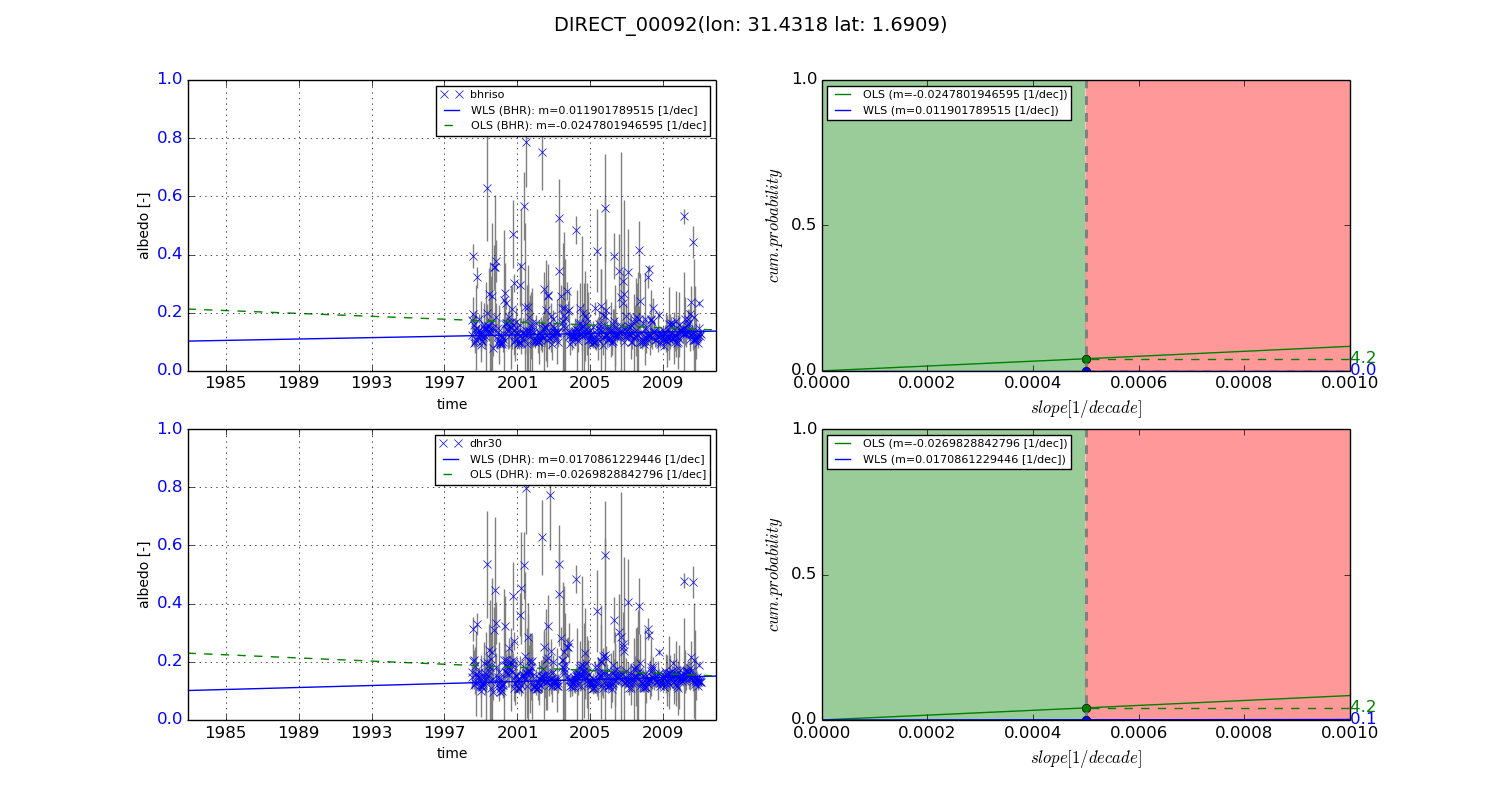
+057/+063 deg (BHR)


BHR statistics

Temporal stability [1/decade]:


abs

rel


Weighted least square:

0.011901789515


Ordinary least square:

-0.0247801946595


Probabilities that GCOS criteria is met:

Weighted least square:

0.0 %

Ordinary least square:

4.2 %


DHR statistics

Temporal stability [1/decade]:


abs

rel


Weighted least square:

0.0170861229446


Ordinary least square:

-0.0269828842796


Probabilities that GCOS criteria is met:

Weighted least square:

0.1 %

Ordinary least square:

4.2 %


Temporal anomaly analyis

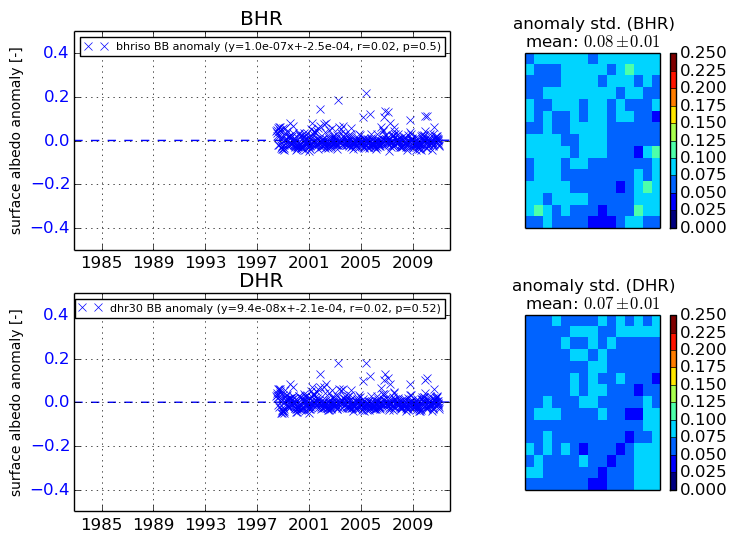
The variance of the temporal anomalies provides an additional measure about the stability of the signal AFTER removal of the mean seasonal cylce.
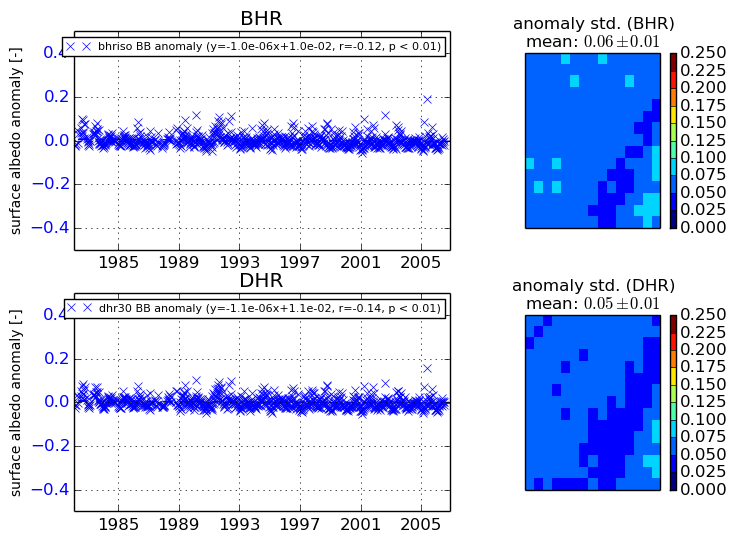
+000 deg


+057/+063 deg