DIRECT_00106


Location

lon / lat [deg]: 16.83 / 52.03

Source network: DIRECT


Geostationary surface albedo (GSA) data


“+000”


“+057/+063”


Landcover information (based on ESA CCI landcover data)


Landcover fractions @ 2km distance


Landcover fractions @ 20 km distance


Legend


Distance to open water bodies [km]:

5.45

Distance to urban areas [km]:

3.15


Radius: 1 km

Number of landcover classes:

1

Dominant landcover type:

10: cropland, rainfed

Fraction of dominant landcover type [%]:

100.0


Radius: 2 km

Number of landcover classes:

2

Dominant landcover type:

10: cropland, rainfed

Fraction of dominant landcover type [%]:

93.0


Radius: 5 km

Number of landcover classes:

2

Dominant landcover type:

10: cropland, rainfed

Fraction of dominant landcover type [%]:

93.0


Radius: 10 km

Number of landcover classes:

6

Dominant landcover type:

10: cropland, rainfed

Fraction of dominant landcover type [%]:

85.0


Radius: 20 km

Number of landcover classes:

6

Dominant landcover type:

10: cropland, rainfed

Fraction of dominant landcover type [%]:

80.0


Disturbances


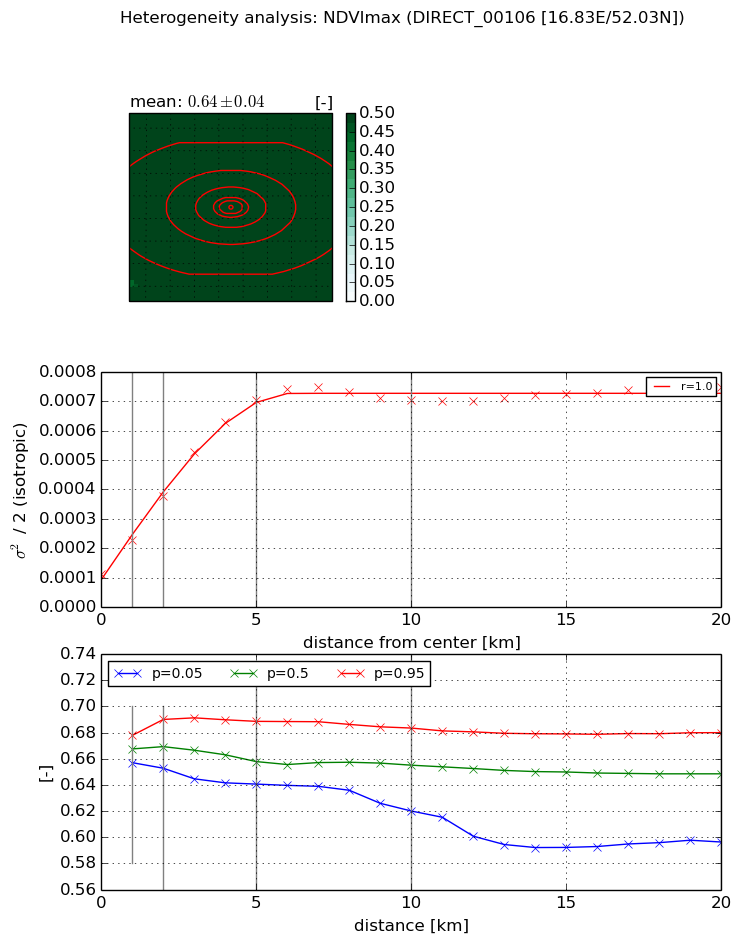
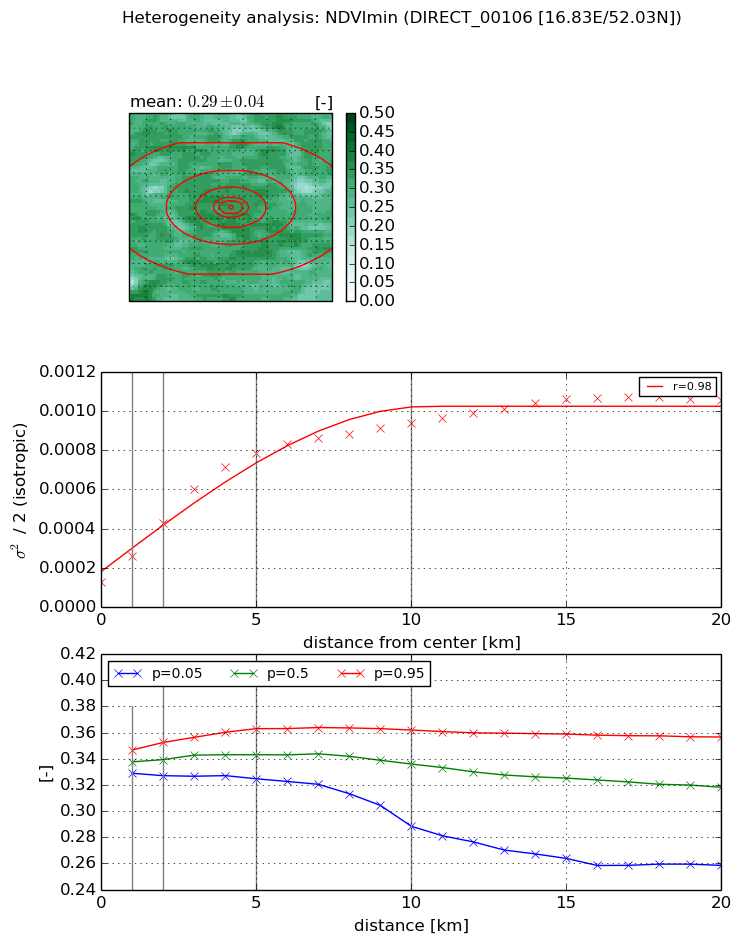
Heterogeneity analysis

The heterogeneity analysis provides information about the spatial and temporal heterogeneity of the site.

Topography


Roman et al. (2009) index


St

3.92154197877

Rcv

0.190012860131

Rse

0.0

Rst

0.0900297327608

Rsv

-0.484962605636


Height range @ 1km [m]

7

Height range @ 2km [m]

13

Height range @ 5km [m]

19

Height range @ 10km [m]

-999

Height range @ 20km [m]

-999


Variance slope @ 1 km

20

Variance slope @ 2 km

17

Variance slope @ 5 km

8

Variance slope @ 10 km

-999

Variance slope @ 20 km

-999


NDVI (max. NDVI composite)


Roman et al. (2009) index


St

6.59486697603e-07

Rcv

0.141478060656

Rse

0.0

Rst

0.140051551079

Rsv

4548992.15593


NDVI range @ 1km [-]

0.02

NDVI range @ 2km [-]

0.04

NDVI range @ 5km [-]

0.05

NDVI range @ 10km [-]

0.06

NDVI range @ 20km [-]

0.08


Variance slope @ 1 km

0.000116432980411

Variance slope @ 2 km

0.000132364930235

Variance slope @ 5 km

0.000123346112062

Variance slope @ 10 km

5.91492887403e-05

Variance slope @ 20 km

2.05907483792e-05


NDVI (min. NDVI composite)I


Roman et al. (2009) index


St

1.77214207748

Rcv

0.348674489987

Rse

0.0

Rst

-0.344192416949

Rsv

-0.999999617774


NDVI range @ 1km [-]

0.02

NDVI range @ 2km [-]

0.03

NDVI range @ 5km [-]

0.04

NDVI range @ 10km [-]

0.07

NDVI range @ 20km [-]

0.1


NDVI slope @ 1 km

0.000134325262268

NDVI slope @ 2 km

0.000151738752431

NDVI slope @ 5 km

0.000138113819764

NDVI slope @ 10 km

7.8868380851e-05

NDVI slope @ 20 km

3.89158208372e-05


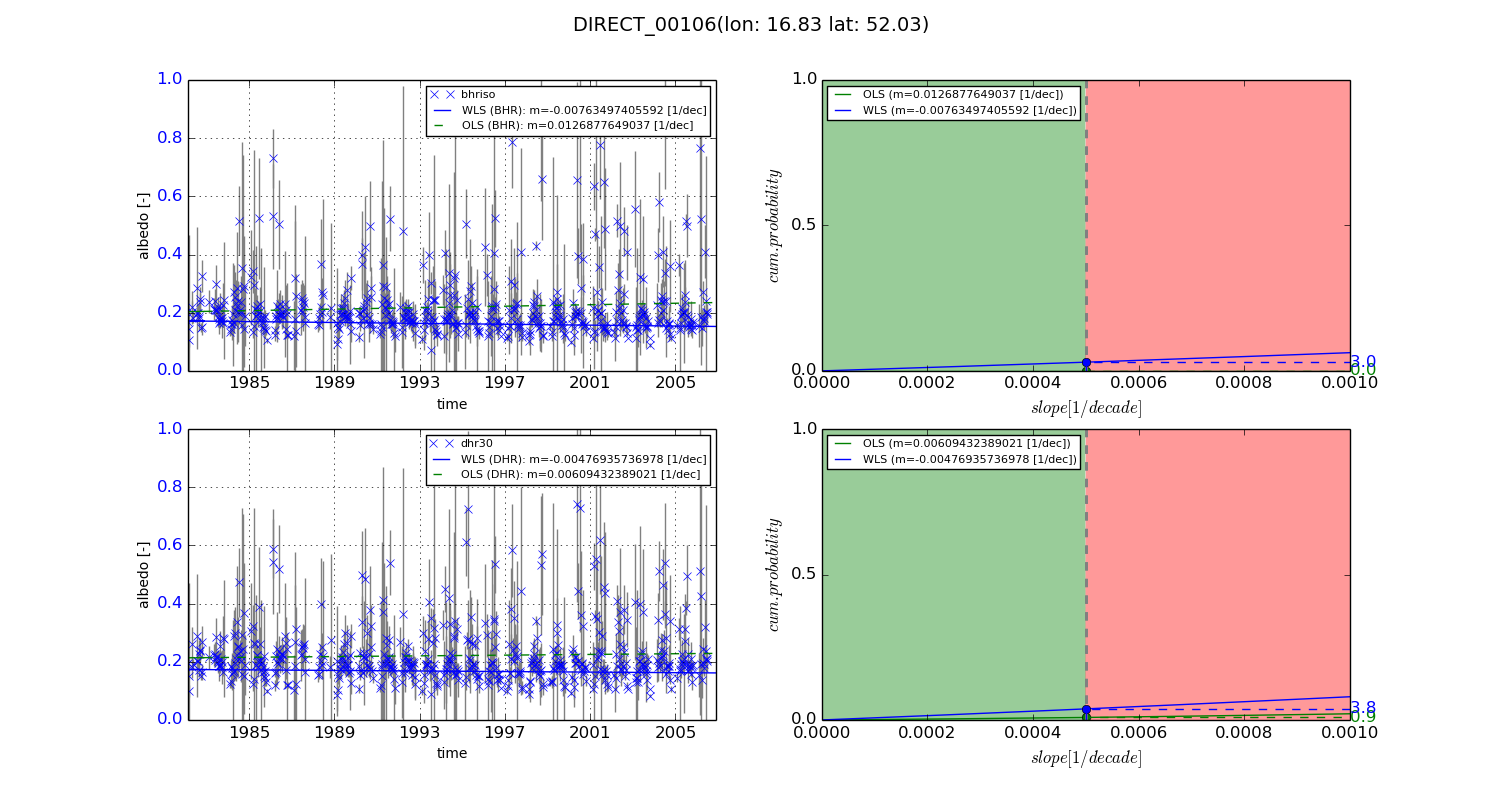
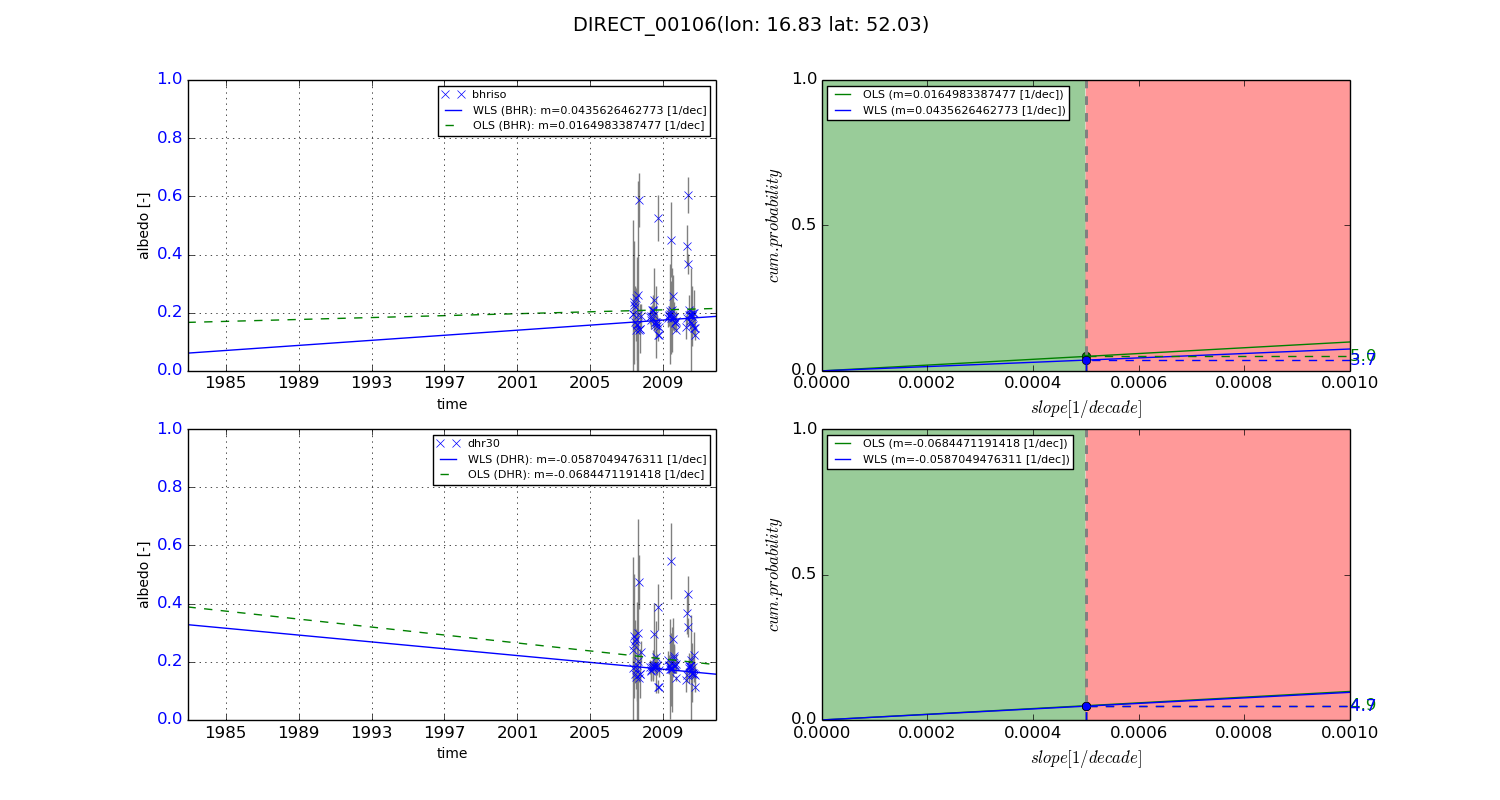
Temporal stability analysis

+000 deg (BHR)


BHR statistics

Temporal stability [1/decade]:


abs

rel


Weighted least square:

-0.00763497405592


Ordinary least square:

0.0126877649037


Probabilities that GCOS criteria is met:

Weighted least square:

3.0 %

Ordinary least square:

0.0 %


DHR statistics

Temporal stability [1/decade]:


abs

rel


Weighted least square:

-0.00476935736978


Ordinary least square:

0.00609432389021


Probabilities that GCOS criteria is met:

Weighted least square:

3.8 %

Ordinary least square:

0.9 %


+057/+063 deg (BHR)


BHR statistics

Temporal stability [1/decade]:


abs

rel


Weighted least square:

0.0435626462773


Ordinary least square:

0.0164983387477


Probabilities that GCOS criteria is met:

Weighted least square:

3.7 %

Ordinary least square:

5.0 %


DHR statistics

Temporal stability [1/decade]:


abs

rel


Weighted least square:

-0.0587049476311


Ordinary least square:

-0.0684471191418


Probabilities that GCOS criteria is met:

Weighted least square:

4.7 %

Ordinary least square:

4.9 %


Temporal anomaly analyis

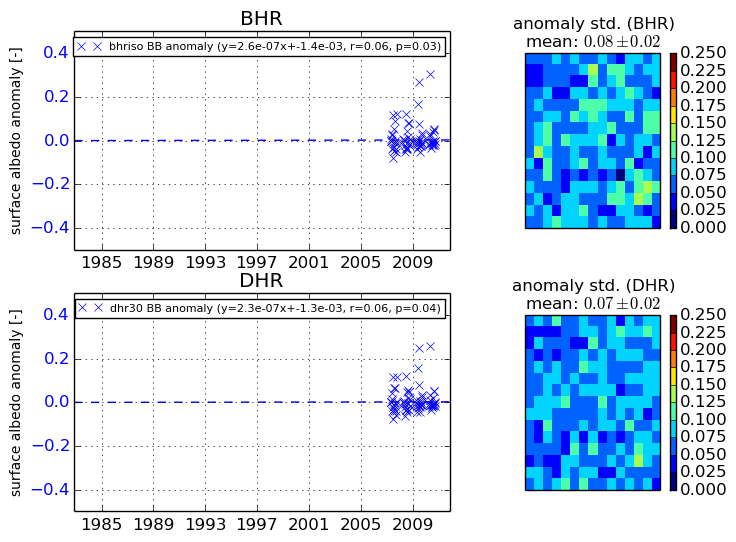
The variance of the temporal anomalies provides an additional measure about the stability of the signal AFTER removal of the mean seasonal cylce.
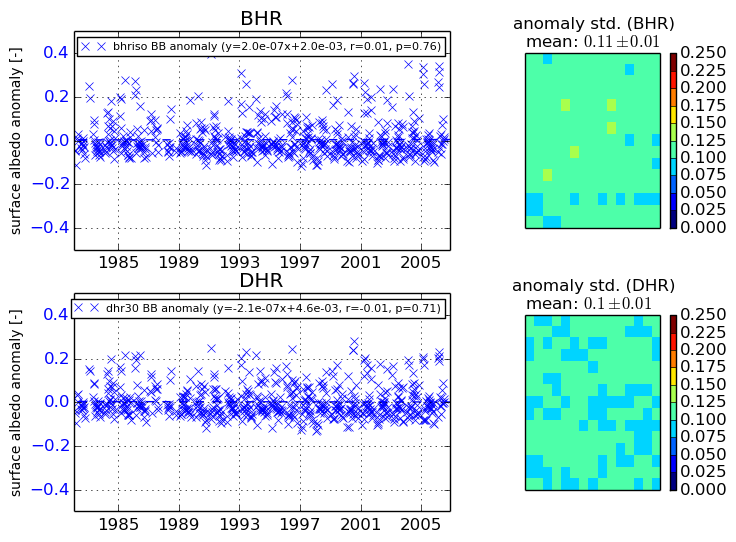
+000 deg


+057/+063 deg