DIRECT_00112


Location

lon / lat [deg]: -0.3436 / 46.2898

Source network: DIRECT


Geostationary surface albedo (GSA) data


“+000”


“+057/+063”


Landcover information (based on ESA CCI landcover data)


Landcover fractions @ 2km distance


Landcover fractions @ 20 km distance


Legend


Distance to open water bodies [km]:

21.77

Distance to urban areas [km]:

1.6


Radius: 1 km

Number of landcover classes:

1

Dominant landcover type:

10: cropland, rainfed

Fraction of dominant landcover type [%]:

100.0


Radius: 2 km

Number of landcover classes:

2

Dominant landcover type:

10: cropland, rainfed

Fraction of dominant landcover type [%]:

96.0


Radius: 5 km

Number of landcover classes:

2

Dominant landcover type:

10: cropland, rainfed

Fraction of dominant landcover type [%]:

90.0


Radius: 10 km

Number of landcover classes:

3

Dominant landcover type:

10: cropland, rainfed

Fraction of dominant landcover type [%]:

84.0


Radius: 20 km

Number of landcover classes:

4

Dominant landcover type:

10: cropland, rainfed

Fraction of dominant landcover type [%]:

83.0


Disturbances


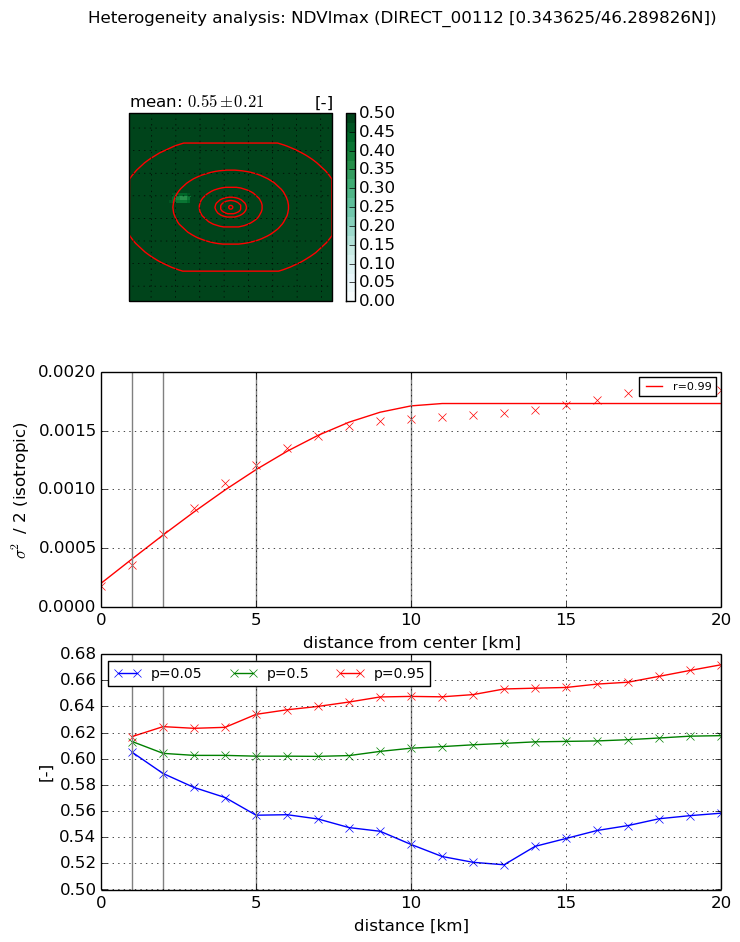
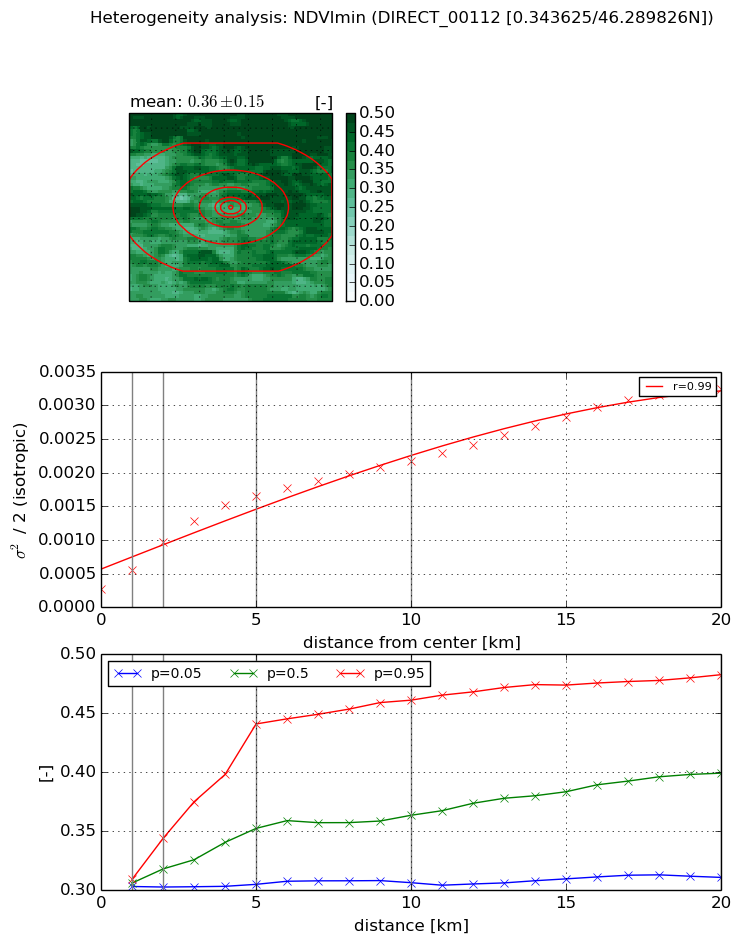
Heterogeneity analysis

The heterogeneity analysis provides information about the spatial and temporal heterogeneity of the site.

Topography


Roman et al. (2009) index


St

2.46202473292

Rcv

0.348916293814

Rse

0.0

Rst

-8.49320435704e-06

Rsv

-0.869584499215


Height range @ 1km [m]

15

Height range @ 2km [m]

30

Height range @ 5km [m]

58

Height range @ 10km [m]

-999

Height range @ 20km [m]

-999


Variance slope @ 1 km

43

Variance slope @ 2 km

43

Variance slope @ 5 km

63

Variance slope @ 10 km

-999

Variance slope @ 20 km

-999


NDVI (max. NDVI composite)


Roman et al. (2009) index


St

1.74215269265

Rcv

0.696292060432

Rse

0.0

Rst

0.025715605501

Rsv

-0.999999832405


NDVI range @ 1km [-]

0.01

NDVI range @ 2km [-]

0.04

NDVI range @ 5km [-]

0.08

NDVI range @ 10km [-]

0.11

NDVI range @ 20km [-]

0.11


Variance slope @ 1 km

0.00017504072994

Variance slope @ 2 km

0.000218977667687

Variance slope @ 5 km

0.00021366664912

Variance slope @ 10 km

0.000148204808035

Variance slope @ 20 km

7.22553279775e-05


NDVI (min. NDVI composite)I


Roman et al. (2009) index


St

2.31533556054

Rcv

0.501607391357

Rse

0.0

Rst

-0.109579619627

Rsv

0.684521503639


NDVI range @ 1km [-]

0.01

NDVI range @ 2km [-]

0.04

NDVI range @ 5km [-]

0.14

NDVI range @ 10km [-]

0.16

NDVI range @ 20km [-]

0.17


NDVI slope @ 1 km

0.000280216120618

NDVI slope @ 2 km

0.000346108881997

NDVI slope @ 5 km

0.000288791626907

NDVI slope @ 10 km

0.000183684213936

NDVI slope @ 20 km

0.000136699750487


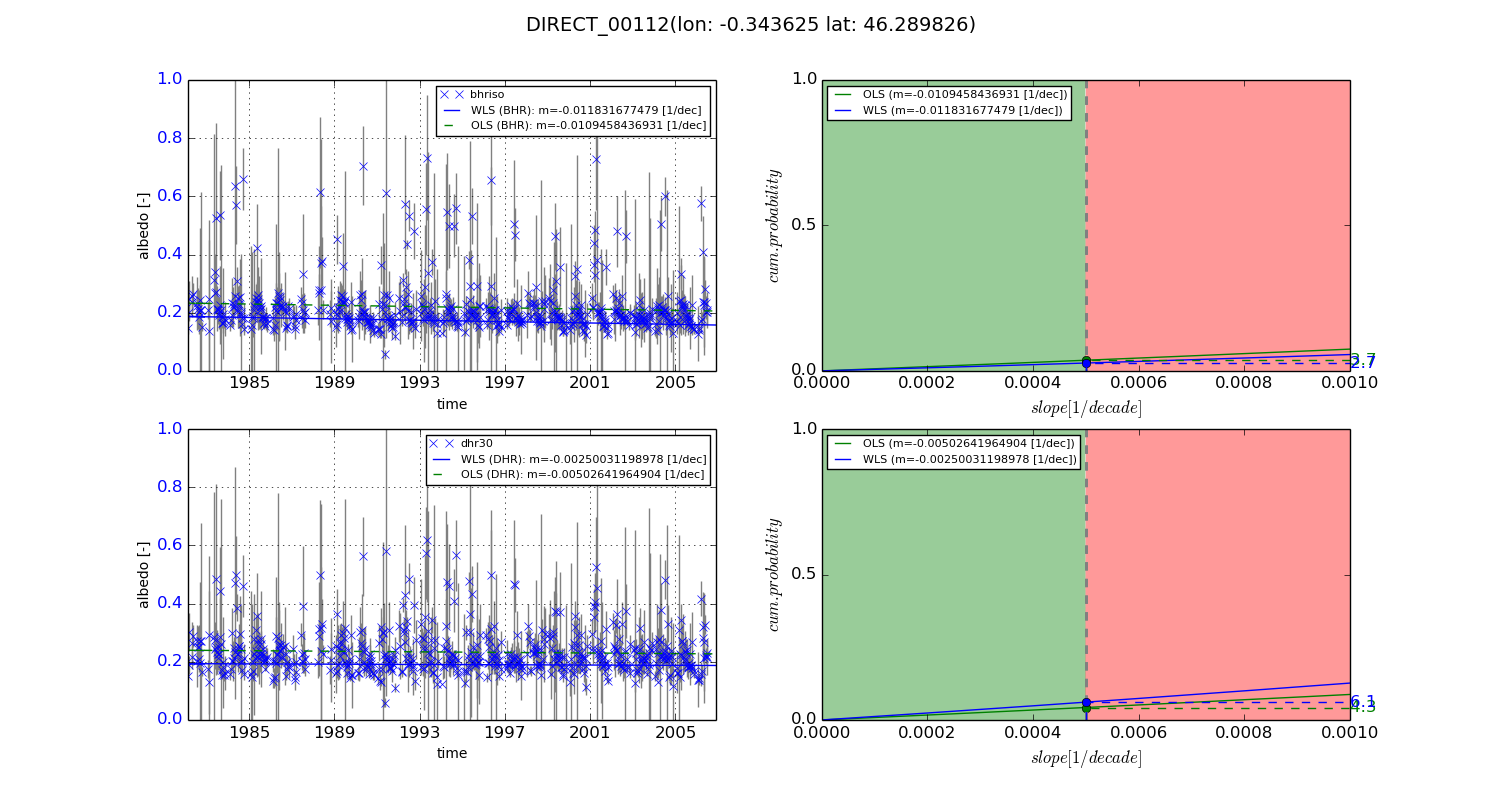
Temporal stability analysis

+000 deg (BHR)


BHR statistics

Temporal stability [1/decade]:


abs

rel


Weighted least square:

-0.011831677479


Ordinary least square:

-0.0109458436931


Probabilities that GCOS criteria is met:

Weighted least square:

2.7 %

Ordinary least square:

3.7 %


DHR statistics

Temporal stability [1/decade]:


abs

rel


Weighted least square:

-0.00250031198978


Ordinary least square:

-0.00502641964904


Probabilities that GCOS criteria is met:

Weighted least square:

6.1 %

Ordinary least square:

4.3 %


+057/+063 deg (BHR)


BHR statistics

Temporal stability [1/decade]:


abs

rel


Weighted least square:

-99999.0


Ordinary least square:

-99999.0


Probabilities that GCOS criteria is met:

Weighted least square:

-99999.0 %

Ordinary least square:

-99999.0 %


DHR statistics

Temporal stability [1/decade]:


abs

rel


Weighted least square:

-99999.0


Ordinary least square:

-99999.0


Probabilities that GCOS criteria is met:

Weighted least square:

-99999.0 %

Ordinary least square:

-99999.0 %


Temporal anomaly analyis

The variance of the temporal anomalies provides an additional measure about the stability of the signal AFTER removal of the mean seasonal cylce.
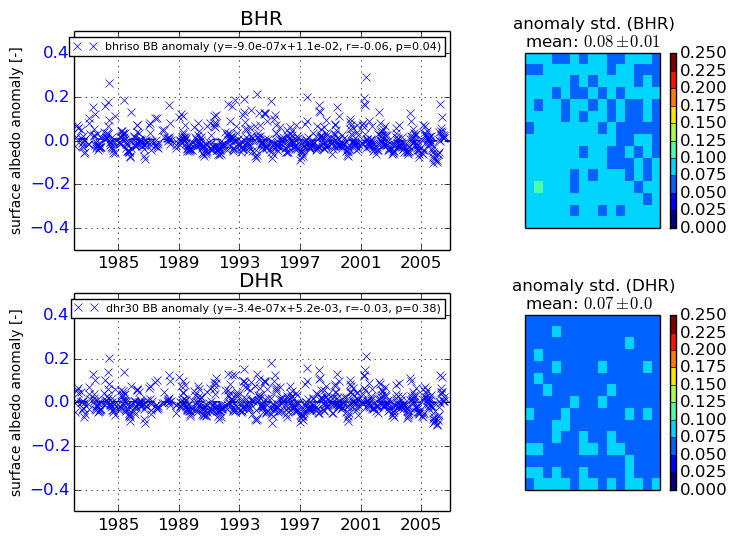
+000 deg


+057/+063 deg