DJEBEL_FURURI


Location

lon / lat [deg]: 32.88 / 16.06

Source network: ALBEDOVAL1


Geostationary surface albedo (GSA) data


“+000”


“+057/+063”


Landcover information (based on ESA CCI landcover data)


Landcover fractions @ 2km distance


Landcover fractions @ 20 km distance


Legend


Distance to open water bodies [km]:

23.6

Distance to urban areas [km]:

20.3


Radius: 1 km

Number of landcover classes:

3

Dominant landcover type:

150: Sparse vegetation (tree, shrub, herbaceous cover) (<15%)

Fraction of dominant landcover type [%]:

66.0


Radius: 2 km

Number of landcover classes:

3

Dominant landcover type:

150: Sparse vegetation (tree, shrub, herbaceous cover) (<15%)

Fraction of dominant landcover type [%]:

64.0


Radius: 5 km

Number of landcover classes:

3

Dominant landcover type:

150: Sparse vegetation (tree, shrub, herbaceous cover) (<15%)

Fraction of dominant landcover type [%]:

56.0


Radius: 10 km

Number of landcover classes:

3

Dominant landcover type:

200: bare areas

Fraction of dominant landcover type [%]:

52.0


Radius: 20 km

Number of landcover classes:

3

Dominant landcover type:

200: bare areas

Fraction of dominant landcover type [%]:

58.0


Disturbances


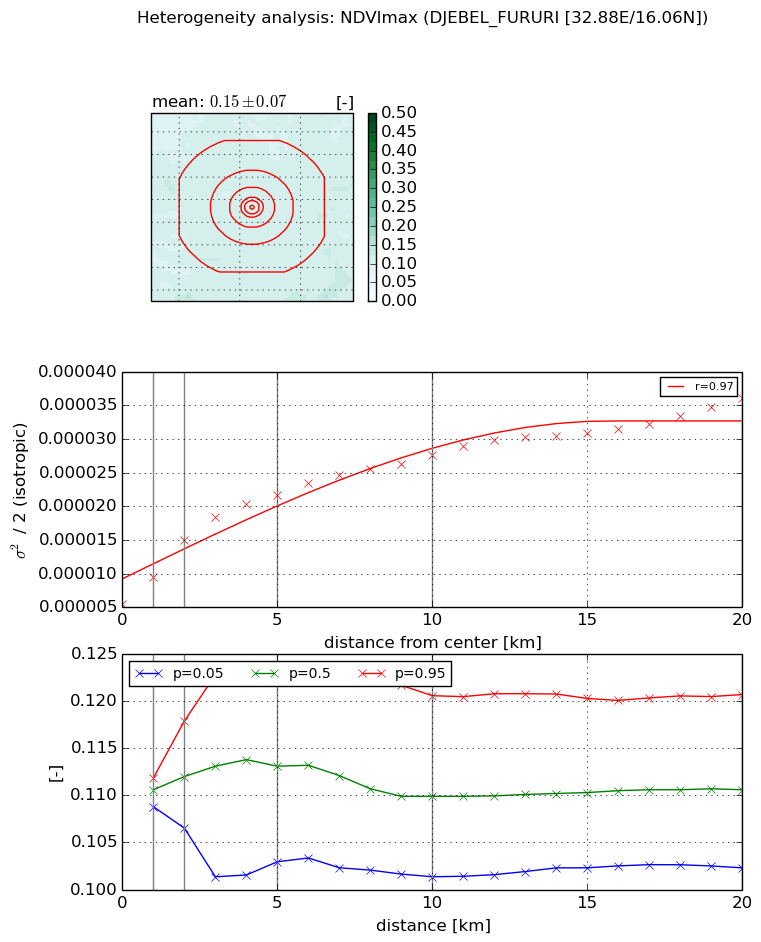
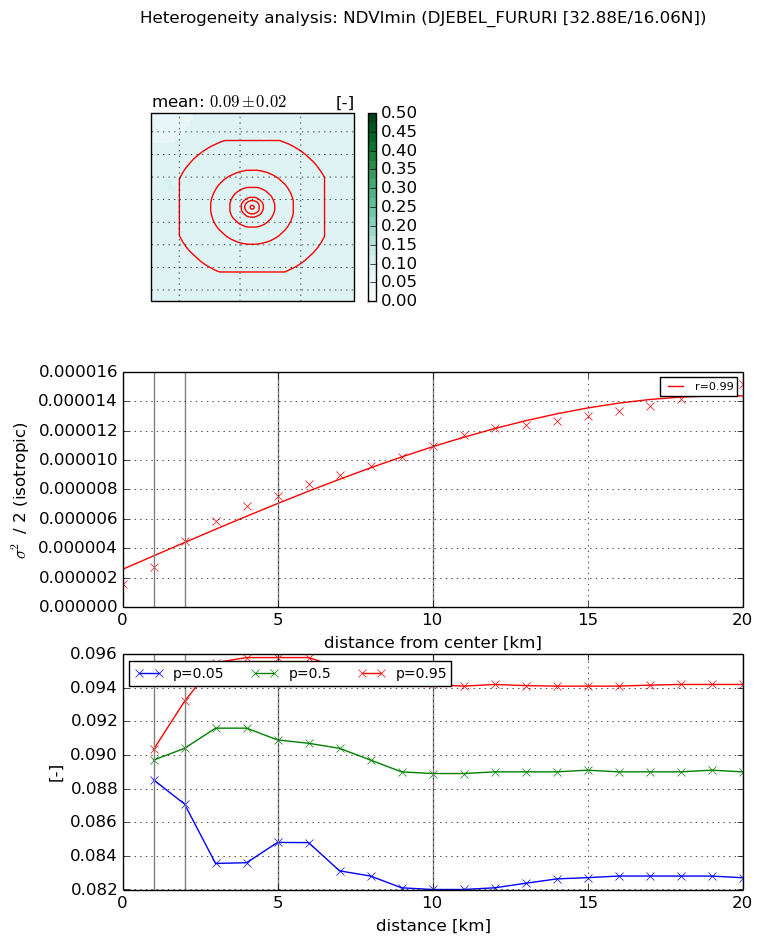
Heterogeneity analysis

The heterogeneity analysis provides information about the spatial and temporal heterogeneity of the site.

Topography


Roman et al. (2009) index


St

1.08922993933

Rcv

0.303456034926

Rse

0.0

Rst

1.79675259732e-05

Rsv

2.45076538418


Height range @ 1km [m]

14

Height range @ 2km [m]

27

Height range @ 5km [m]

51

Height range @ 10km [m]

-999

Height range @ 20km [m]

-999


Variance slope @ 1 km

19

Variance slope @ 2 km

30

Variance slope @ 5 km

49

Variance slope @ 10 km

-999

Variance slope @ 20 km

-999


NDVI (max. NDVI composite)


Roman et al. (2009) index


St

2.34525787845e-06

Rcv

-0.000159786589517

Rse

0.0

Rst

0.26267255852

Rsv

1279176.76395


NDVI range @ 1km [-]

0.0

NDVI range @ 2km [-]

0.01

NDVI range @ 5km [-]

0.02

NDVI range @ 10km [-]

0.02

NDVI range @ 20km [-]

0.02


Variance slope @ 1 km

4.04240040243e-06

Variance slope @ 2 km

4.78744492356e-06

Variance slope @ 5 km

3.34030128915e-06

Variance slope @ 10 km

2.04249621416e-06

Variance slope @ 20 km

1.23036353692e-06


NDVI (min. NDVI composite)I


Roman et al. (2009) index


St

2.59746960496

Rcv

-0.0126812685753

Rse

0.0

Rst

0.0626339519726

Rsv

1.07965498363


NDVI range @ 1km [-]

0.0

NDVI range @ 2km [-]

0.01

NDVI range @ 5km [-]

0.01

NDVI range @ 10km [-]

0.01

NDVI range @ 20km [-]

0.01


NDVI slope @ 1 km

1.19761103233e-06

NDVI slope @ 2 km

1.49494767948e-06

NDVI slope @ 5 km

1.25126755075e-06

NDVI slope @ 10 km

9.07445721648e-07

NDVI slope @ 20 km

6.17559996501e-07


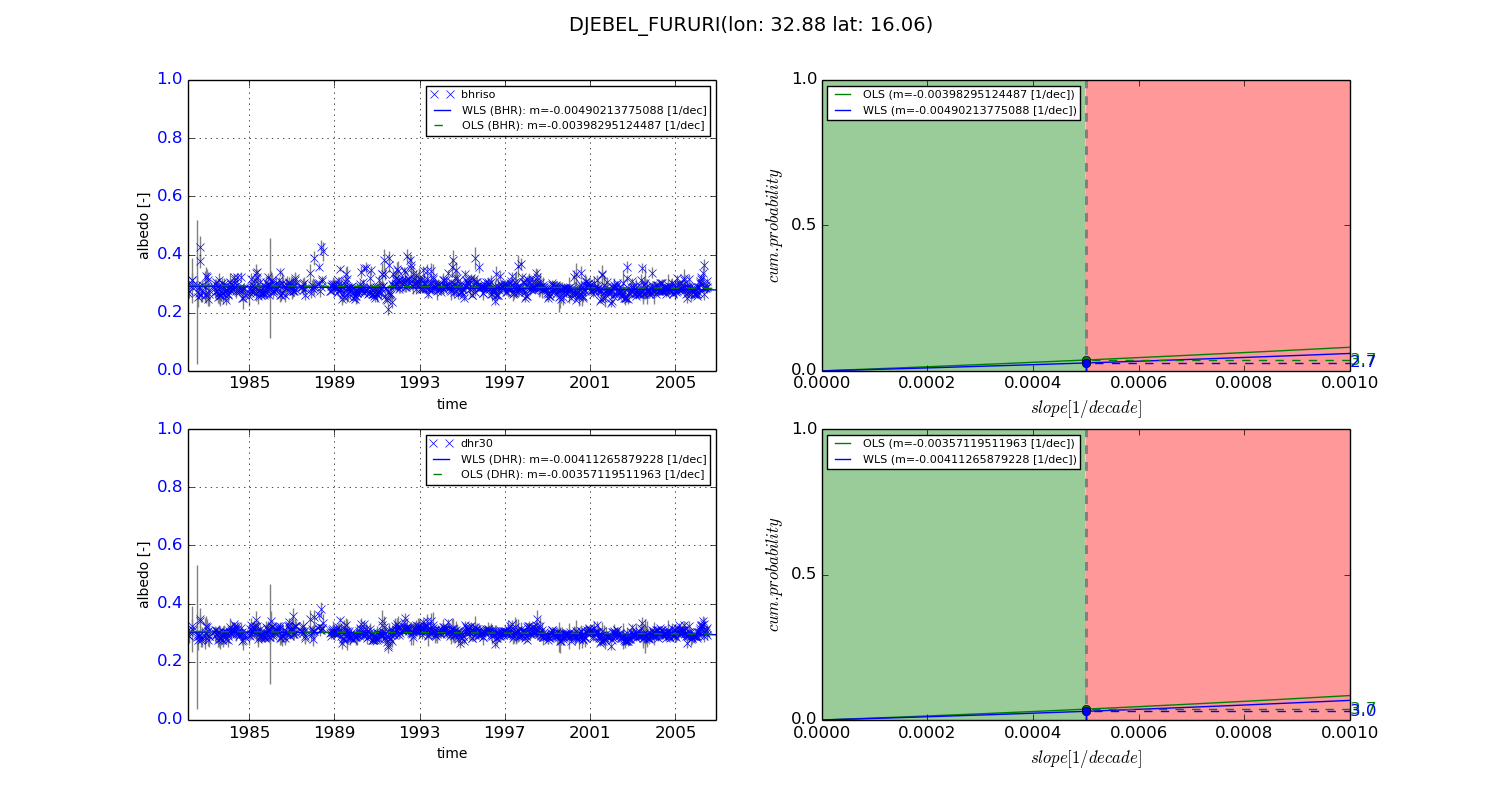
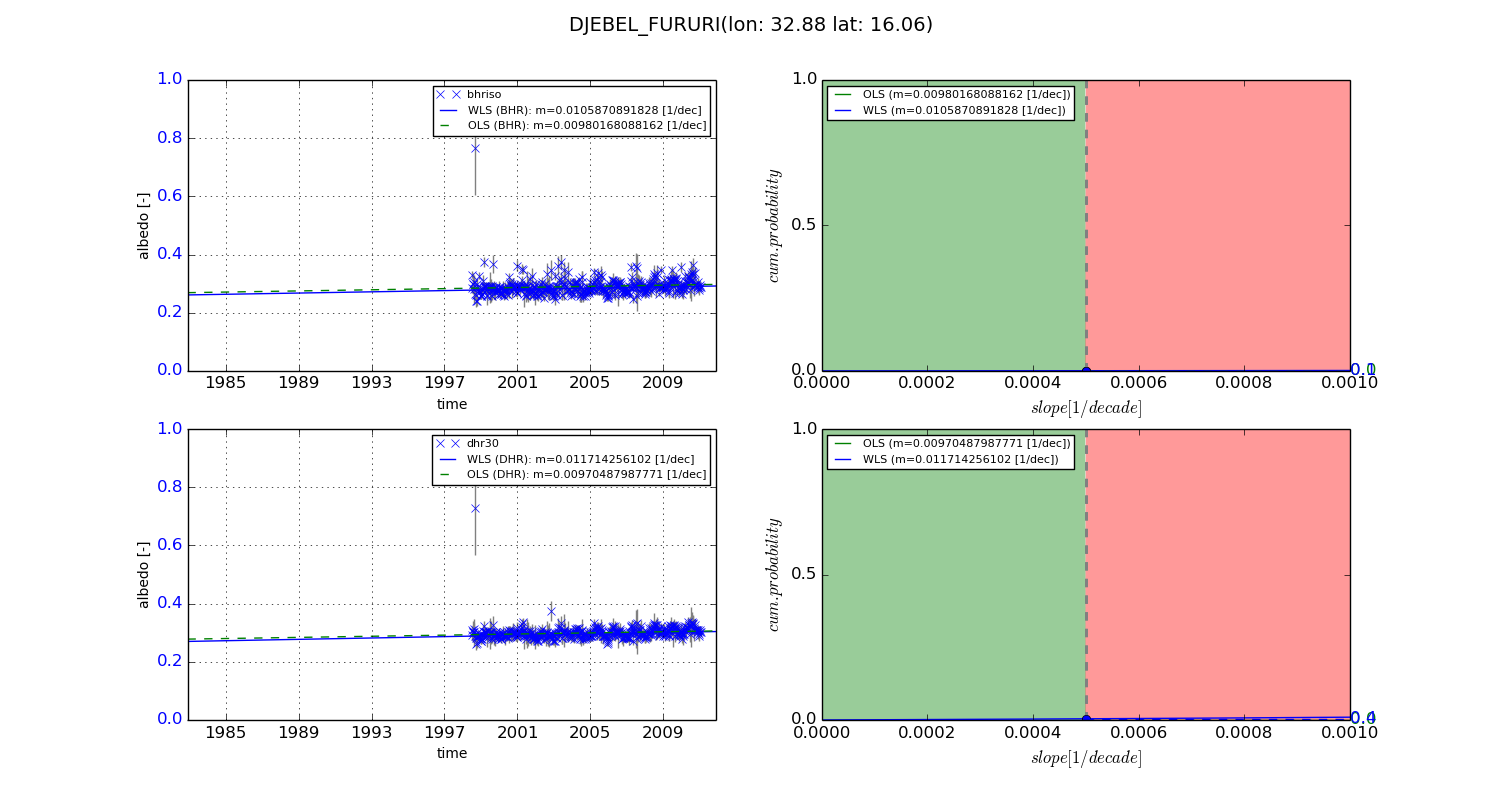
Temporal stability analysis

+000 deg (BHR)


BHR statistics

Temporal stability [1/decade]:


abs

rel


Weighted least square:

-0.00490213775088


Ordinary least square:

-0.00398295124487


Probabilities that GCOS criteria is met:

Weighted least square:

2.7 %

Ordinary least square:

3.7 %


DHR statistics

Temporal stability [1/decade]:


abs

rel


Weighted least square:

-0.00411265879228


Ordinary least square:

-0.00357119511963


Probabilities that GCOS criteria is met:

Weighted least square:

3.0 %

Ordinary least square:

3.7 %


+057/+063 deg (BHR)


BHR statistics

Temporal stability [1/decade]:


abs

rel


Weighted least square:

0.0105870891828


Ordinary least square:

0.00980168088162


Probabilities that GCOS criteria is met:

Weighted least square:

0.1 %

Ordinary least square:

0.0 %


DHR statistics

Temporal stability [1/decade]:


abs

rel


Weighted least square:

0.011714256102


Ordinary least square:

0.00970487987771


Probabilities that GCOS criteria is met:

Weighted least square:

0.4 %

Ordinary least square:

0.0 %


Temporal anomaly analyis

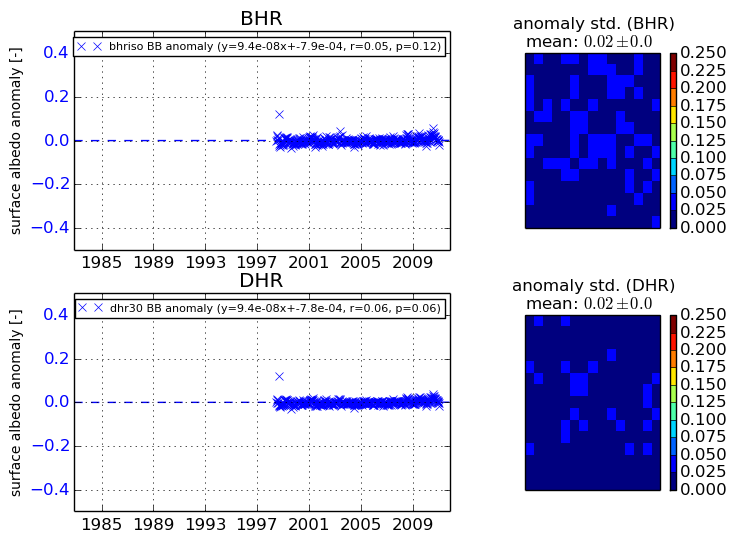
The variance of the temporal anomalies provides an additional measure about the stability of the signal AFTER removal of the mean seasonal cylce.
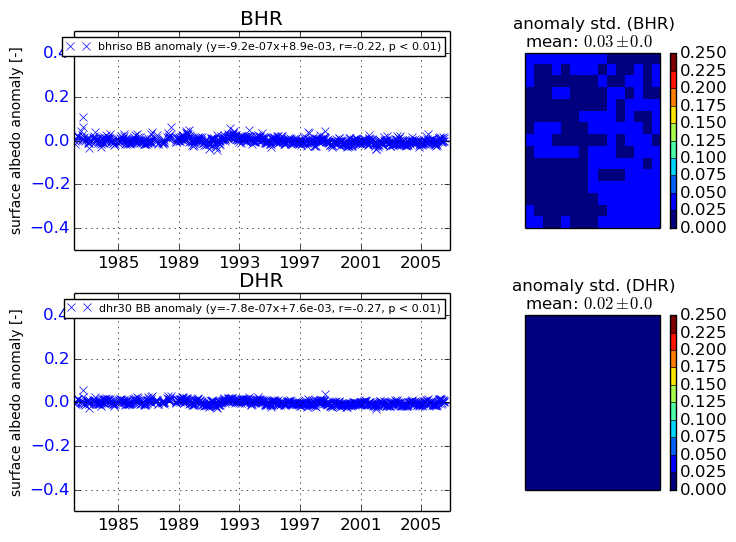
+000 deg


+057/+063 deg