DK-FOU


Location

lon / lat [deg]: 9.5872 / 56.4842

Source network: FLUXNET


Geostationary surface albedo (GSA) data


“+000”


“+057/+063”


Landcover information (based on ESA CCI landcover data)


Landcover fractions @ 2km distance


Landcover fractions @ 20 km distance


Legend


Distance to open water bodies [km]:

3.84

Distance to urban areas [km]:

0.37


Radius: 1 km

Number of landcover classes:

3

Dominant landcover type:

10: cropland, rainfed

Fraction of dominant landcover type [%]:

72.0


Radius: 2 km

Number of landcover classes:

4

Dominant landcover type:

10: cropland, rainfed

Fraction of dominant landcover type [%]:

89.0


Radius: 5 km

Number of landcover classes:

10

Dominant landcover type:

10: cropland, rainfed

Fraction of dominant landcover type [%]:

80.0


Radius: 10 km

Number of landcover classes:

10

Dominant landcover type:

10: cropland, rainfed

Fraction of dominant landcover type [%]:

78.0


Radius: 20 km

Number of landcover classes:

10

Dominant landcover type:

10: cropland, rainfed

Fraction of dominant landcover type [%]:

75.0


Disturbances


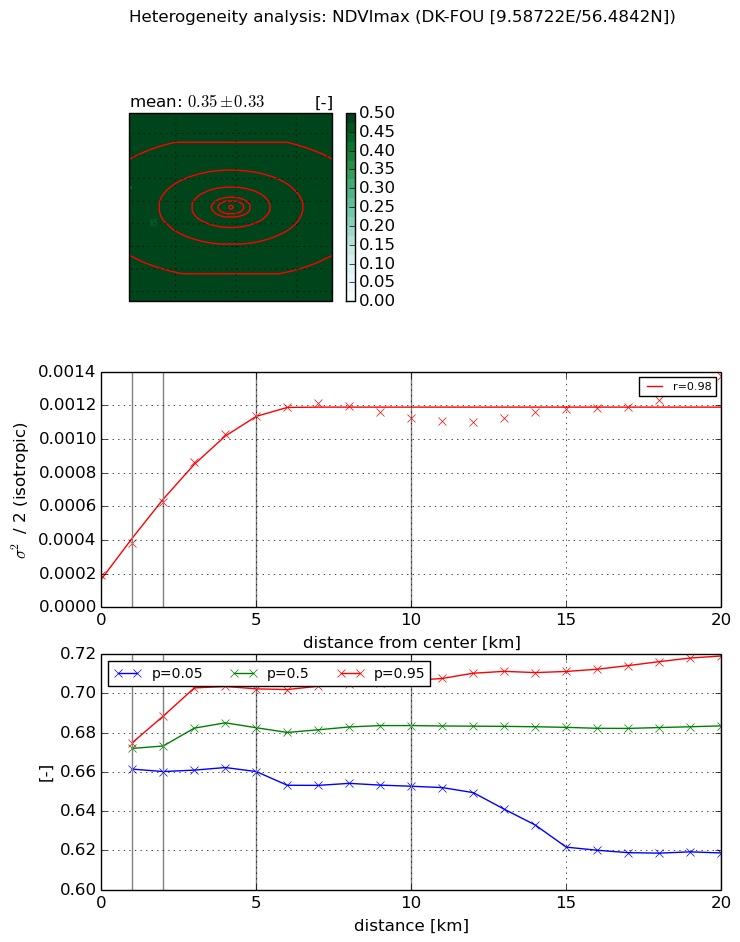
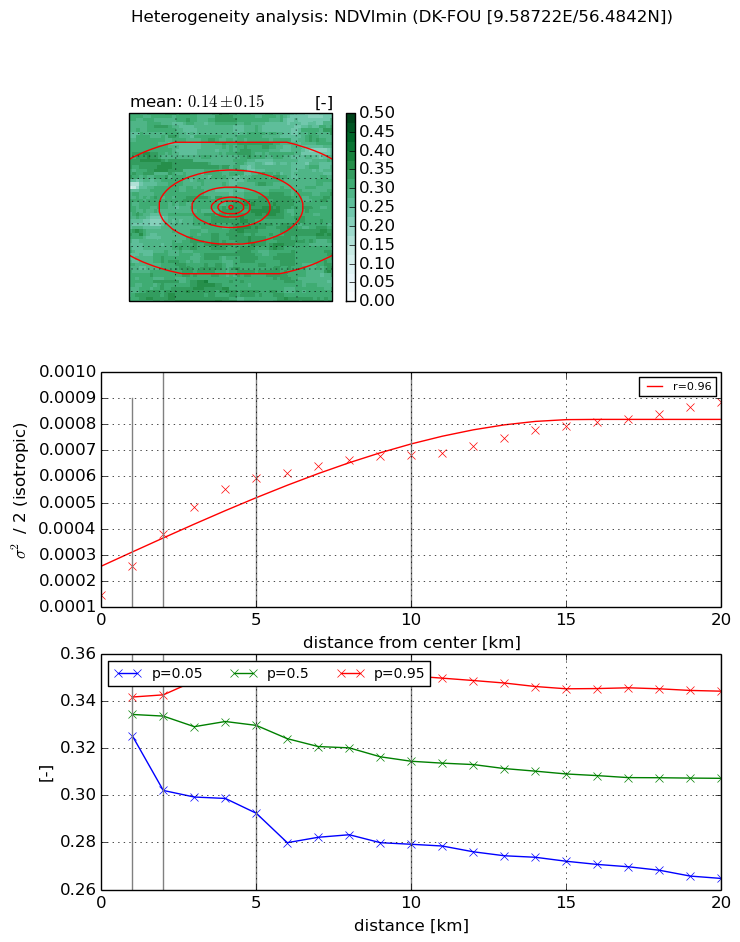
Heterogeneity analysis

The heterogeneity analysis provides information about the spatial and temporal heterogeneity of the site.

Topography


Roman et al. (2009) index


St

4.63019129122

Rcv

0.487043823778

Rse

0.0

Rst

-0.0392582174618

Rsv

0.121619353647


Height range @ 1km [m]

12

Height range @ 2km [m]

23

Height range @ 5km [m]

56

Height range @ 10km [m]

-999

Height range @ 20km [m]

-999


Variance slope @ 1 km

162

Variance slope @ 2 km

133

Variance slope @ 5 km

64

Variance slope @ 10 km

-999

Variance slope @ 20 km

-999


NDVI (max. NDVI composite)


Roman et al. (2009) index


St

0.901302953814

Rcv

0.0254567320624

Rse

0.0

Rst

-0.97551845192

Rsv

2.32753937076


NDVI range @ 1km [-]

0.01

NDVI range @ 2km [-]

0.03

NDVI range @ 5km [-]

0.04

NDVI range @ 10km [-]

0.05

NDVI range @ 20km [-]

0.1


Variance slope @ 1 km

0.000191781269552

Variance slope @ 2 km

0.000216551566722

Variance slope @ 5 km

0.000197350531183

Variance slope @ 10 km

9.40489007778e-05

Variance slope @ 20 km

3.61700184903e-05


NDVI (min. NDVI composite)I


Roman et al. (2009) index


St

1.1621473009

Rcv

0.246658496382

Rse

0.0

Rst

0.0418336394994

Rsv

2.29293622323


NDVI range @ 1km [-]

0.02

NDVI range @ 2km [-]

0.04

NDVI range @ 5km [-]

0.06

NDVI range @ 10km [-]

0.07

NDVI range @ 20km [-]

0.08


NDVI slope @ 1 km

0.000109878386764

NDVI slope @ 2 km

0.000115609239222

NDVI slope @ 5 km

9.18211455926e-05

NDVI slope @ 10 km

5.09070638259e-05

NDVI slope @ 20 km

2.93047629309e-05


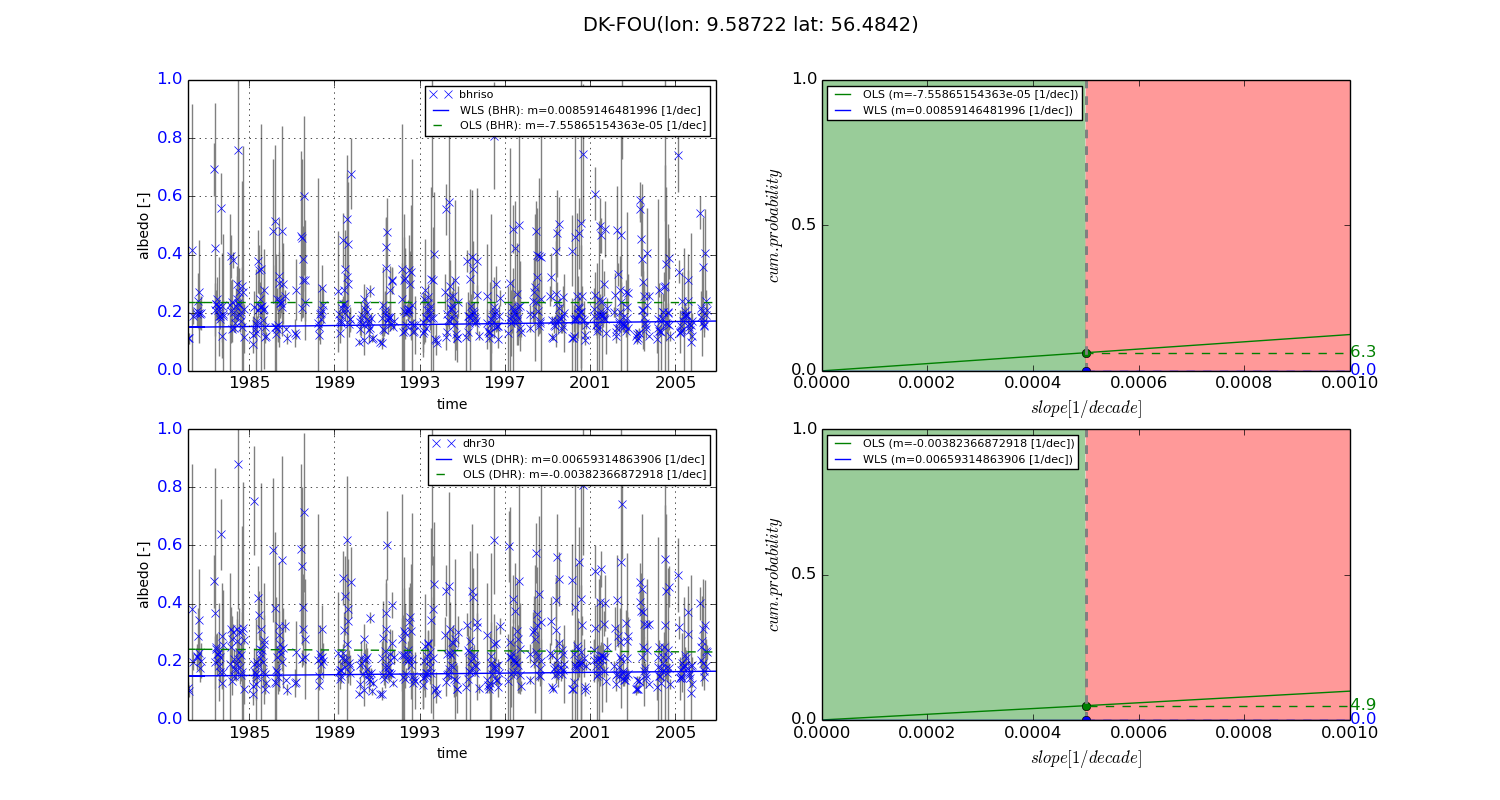
Temporal stability analysis

+000 deg (BHR)


BHR statistics

Temporal stability [1/decade]:


abs

rel


Weighted least square:

0.00859146481996


Ordinary least square:

-7.55865154363e-05


Probabilities that GCOS criteria is met:

Weighted least square:

0.0 %

Ordinary least square:

6.3 %


DHR statistics

Temporal stability [1/decade]:


abs

rel


Weighted least square:

0.00659314863906


Ordinary least square:

-0.00382366872918


Probabilities that GCOS criteria is met:

Weighted least square:

0.0 %

Ordinary least square:

4.9 %


+057/+063 deg (BHR)


BHR statistics

Temporal stability [1/decade]:


abs

rel


Weighted least square:

-99999.0


Ordinary least square:

-99999.0


Probabilities that GCOS criteria is met:

Weighted least square:

-99999.0 %

Ordinary least square:

-99999.0 %


DHR statistics

Temporal stability [1/decade]:


abs

rel


Weighted least square:

-99999.0


Ordinary least square:

-99999.0


Probabilities that GCOS criteria is met:

Weighted least square:

-99999.0 %

Ordinary least square:

-99999.0 %


Temporal anomaly analyis

The variance of the temporal anomalies provides an additional measure about the stability of the signal AFTER removal of the mean seasonal cylce.
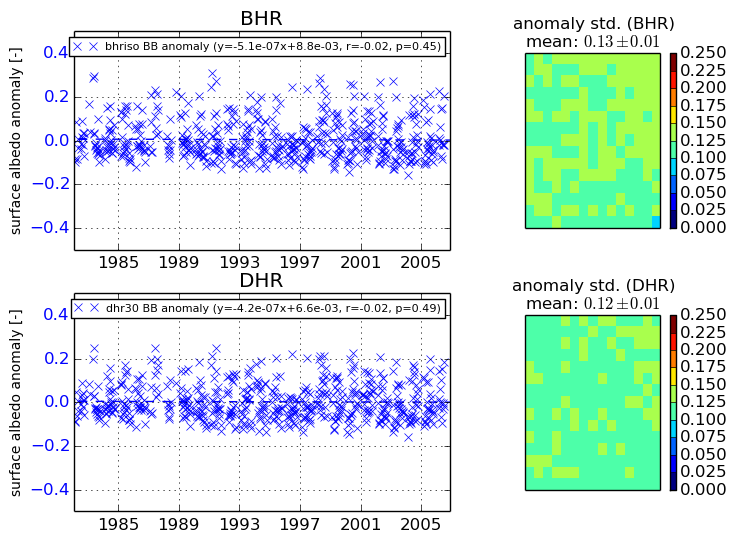
+000 deg


+057/+063 deg