DRAGON_DRUMMOND


Location

lon / lat [deg]: -119.7414 / 36.7056

Source network: AERONET


Geostationary surface albedo (GSA) data


“+000”


“+057/+063”


Landcover information (based on ESA CCI landcover data)


Landcover fractions @ 2km distance


Landcover fractions @ 20 km distance


Legend


Distance to open water bodies [km]:

9.14

Distance to urban areas [km]:

0.18


Radius: 1 km

Number of landcover classes:

1

Dominant landcover type:

190: urban areas

Fraction of dominant landcover type [%]:

100.0


Radius: 2 km

Number of landcover classes:

3

Dominant landcover type:

190: urban areas

Fraction of dominant landcover type [%]:

94.0


Radius: 5 km

Number of landcover classes:

4

Dominant landcover type:

190: urban areas

Fraction of dominant landcover type [%]:

78.0


Radius: 10 km

Number of landcover classes:

4

Dominant landcover type:

190: urban areas

Fraction of dominant landcover type [%]:

49.0


Radius: 20 km

Number of landcover classes:

5

Dominant landcover type:

10: cropland, rainfed

Fraction of dominant landcover type [%]:

45.0


Disturbances


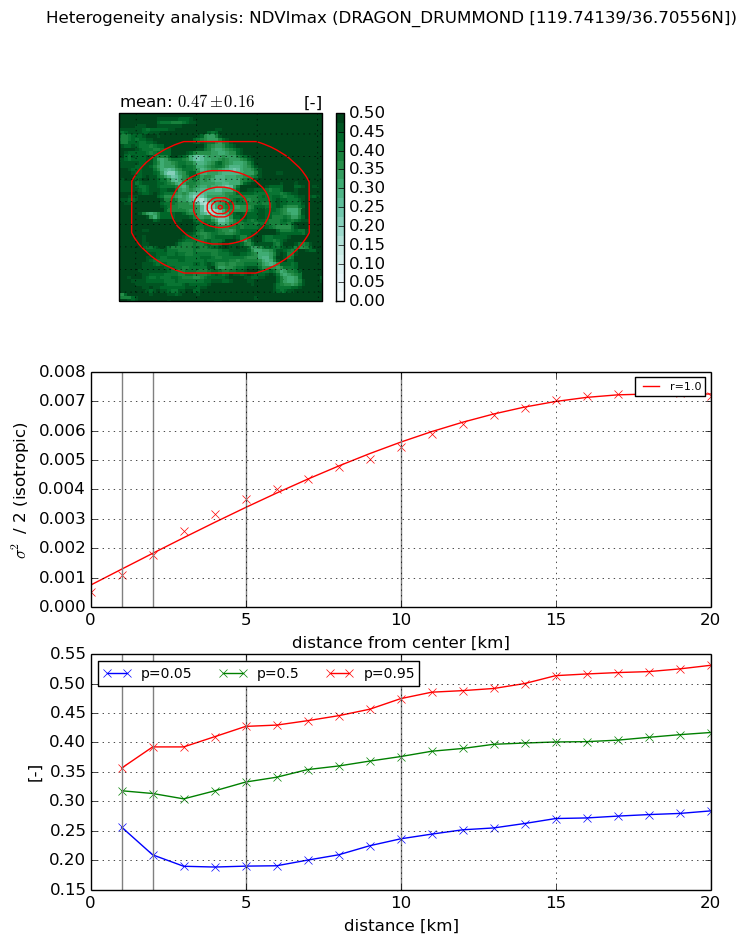
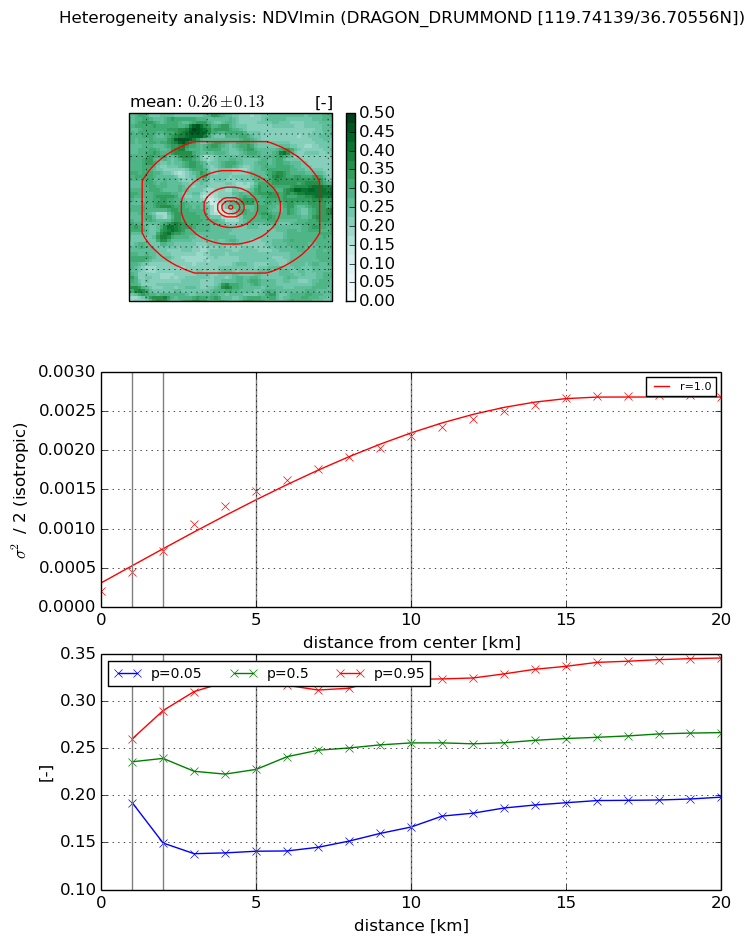
Heterogeneity analysis

The heterogeneity analysis provides information about the spatial and temporal heterogeneity of the site.

Topography


Roman et al. (2009) index


St

0.225723022438

Rcv

0.471941767433

Rse

0.0

Rst

1.1704144513e-07

Rsv

12.8186829157


Height range @ 1km [m]

6

Height range @ 2km [m]

7

Height range @ 5km [m]

14

Height range @ 10km [m]

-999

Height range @ 20km [m]

-999


Variance slope @ 1 km

2

Variance slope @ 2 km

1

Variance slope @ 5 km

3

Variance slope @ 10 km

-999

Variance slope @ 20 km

-999


NDVI (max. NDVI composite)


Roman et al. (2009) index


St

1.543080202e-07

Rcv

-0.0130248401911

Rse

0.0

Rst

0.182526124836

Rsv

19441633.4675


NDVI range @ 1km [-]

0.1

NDVI range @ 2km [-]

0.18

NDVI range @ 5km [-]

0.24

NDVI range @ 10km [-]

0.24

NDVI range @ 20km [-]

0.25


Variance slope @ 1 km

0.000593867070656

Variance slope @ 2 km

0.000635360185903

Variance slope @ 5 km

0.000652236026905

Variance slope @ 10 km

0.000490050620578

Variance slope @ 20 km

0.000339412829327


NDVI (min. NDVI composite)I


Roman et al. (2009) index


St

1.77198041703e-07

Rcv

-0.048408607694

Rse

0.0

Rst

0.248785619516

Rsv

16930209.3776


NDVI range @ 1km [-]

0.07

NDVI range @ 2km [-]

0.14

NDVI range @ 5km [-]

0.18

NDVI range @ 10km [-]

0.16

NDVI range @ 20km [-]

0.15


NDVI slope @ 1 km

0.000241308667693

NDVI slope @ 2 km

0.000257446965819

NDVI slope @ 5 km

0.000263737637147

NDVI slope @ 10 km

0.000196072700187

NDVI slope @ 20 km

0.000122311014797


Temporal stability analysis

+000 deg (BHR)


BHR statistics

Temporal stability [1/decade]:


abs

rel


Weighted least square:

None


Ordinary least square:

None


Probabilities that GCOS criteria is met:

Weighted least square:

None %

Ordinary least square:

None %


DHR statistics

Temporal stability [1/decade]:


abs

rel


Weighted least square:

None


Ordinary least square:

None


Probabilities that GCOS criteria is met:

Weighted least square:

None %

Ordinary least square:

None %


+057/+063 deg (BHR)


BHR statistics

Temporal stability [1/decade]:


abs

rel


Weighted least square:

None


Ordinary least square:

None


Probabilities that GCOS criteria is met:

Weighted least square:

None %

Ordinary least square:

None %


DHR statistics

Temporal stability [1/decade]:


abs

rel


Weighted least square:

None


Ordinary least square:

None


Probabilities that GCOS criteria is met:

Weighted least square:

None %

Ordinary least square:

None %


Temporal anomaly analyis

The variance of the temporal anomalies provides an additional measure about the stability of the signal AFTER removal of the mean seasonal cylce.

+000 deg


+057/+063 deg