DRAGON_FORT_COLLINS


Location

lon / lat [deg]: -105.1414 / 40.5928

Source network: AERONET


Geostationary surface albedo (GSA) data


“+000”


“+057/+063”


Landcover information (based on ESA CCI landcover data)


Landcover fractions @ 2km distance


Landcover fractions @ 20 km distance


Legend


Distance to open water bodies [km]:

1.36

Distance to urban areas [km]:

0.35


Radius: 1 km

Number of landcover classes:

2

Dominant landcover type:

130: grassland

Fraction of dominant landcover type [%]:

74.0


Radius: 2 km

Number of landcover classes:

3

Dominant landcover type:

130: grassland

Fraction of dominant landcover type [%]:

59.0


Radius: 5 km

Number of landcover classes:

5

Dominant landcover type:

130: grassland

Fraction of dominant landcover type [%]:

43.0


Radius: 10 km

Number of landcover classes:

5

Dominant landcover type:

130: grassland

Fraction of dominant landcover type [%]:

42.0


Radius: 20 km

Number of landcover classes:

5

Dominant landcover type:

130: grassland

Fraction of dominant landcover type [%]:

48.0


Disturbances


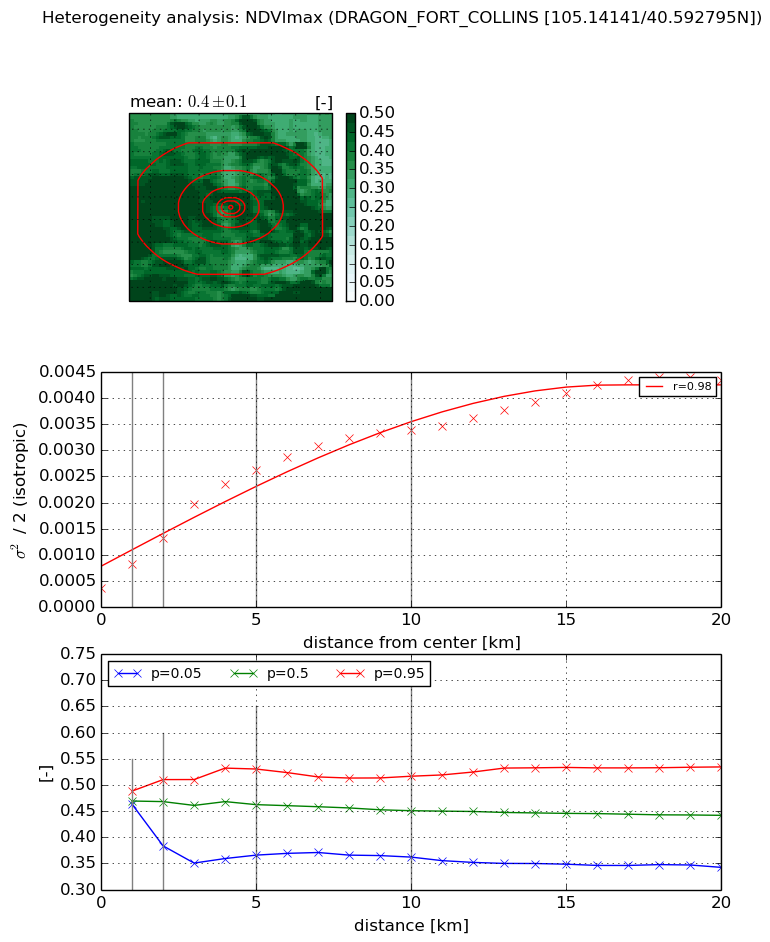
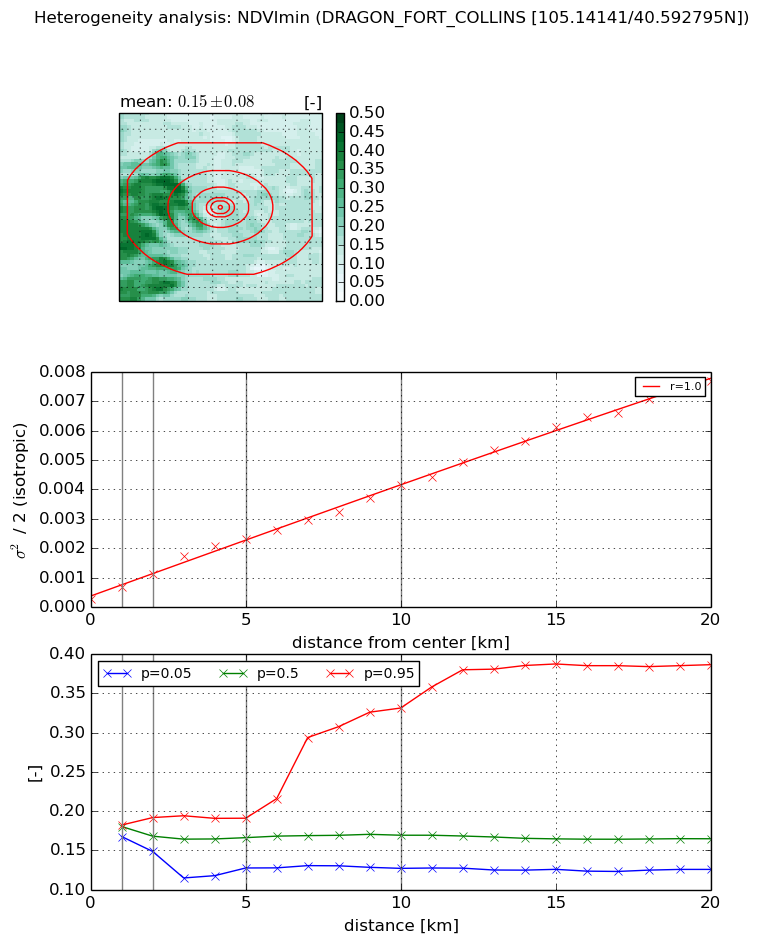
Heterogeneity analysis

The heterogeneity analysis provides information about the spatial and temporal heterogeneity of the site.

Topography


Roman et al. (2009) index


St

2.71546153981

Rcv

0.917448227482

Rse

0.0

Rst

-3.62212094356e-07

Rsv

-0.187335976766


Height range @ 1km [m]

24

Height range @ 2km [m]

77

Height range @ 5km [m]

240

Height range @ 10km [m]

-999

Height range @ 20km [m]

-999


Variance slope @ 1 km

1438

Variance slope @ 2 km

1855

Variance slope @ 5 km

2275

Variance slope @ 10 km

-999

Variance slope @ 20 km

-999


NDVI (max. NDVI composite)


Roman et al. (2009) index


St

13.5800240953

Rcv

-0.0900758410449

Rse

0.0

Rst

-0.0134102896408

Rsv

-0.117426584854


NDVI range @ 1km [-]

0.03

NDVI range @ 2km [-]

0.13

NDVI range @ 5km [-]

0.16

NDVI range @ 10km [-]

0.15

NDVI range @ 20km [-]

0.19


Variance slope @ 1 km

0.000453251412746

Variance slope @ 2 km

0.000473733596534

Variance slope @ 5 km

0.000471630320564

Variance slope @ 10 km

0.000306064674195

Variance slope @ 20 km

0.000180600671986


NDVI (min. NDVI composite)I


Roman et al. (2009) index


St

8.9125724701

Rcv

-0.0859084526543

Rse

0.0

Rst

0.0813133438785

Rsv

-0.169381357053


NDVI range @ 1km [-]

0.01

NDVI range @ 2km [-]

0.04

NDVI range @ 5km [-]

0.06

NDVI range @ 10km [-]

0.2

NDVI range @ 20km [-]

0.26


NDVI slope @ 1 km

0.00038307719012

NDVI slope @ 2 km

0.00041969956286

NDVI slope @ 5 km

0.00042729490535

NDVI slope @ 10 km

0.000369706887606

NDVI slope @ 20 km

0.000371034829307


Temporal stability analysis

+000 deg (BHR)


BHR statistics

Temporal stability [1/decade]:


abs

rel


Weighted least square:

None


Ordinary least square:

None


Probabilities that GCOS criteria is met:

Weighted least square:

None %

Ordinary least square:

None %


DHR statistics

Temporal stability [1/decade]:


abs

rel


Weighted least square:

None


Ordinary least square:

None


Probabilities that GCOS criteria is met:

Weighted least square:

None %

Ordinary least square:

None %


+057/+063 deg (BHR)


BHR statistics

Temporal stability [1/decade]:


abs

rel


Weighted least square:

None


Ordinary least square:

None


Probabilities that GCOS criteria is met:

Weighted least square:

None %

Ordinary least square:

None %


DHR statistics

Temporal stability [1/decade]:


abs

rel


Weighted least square:

None


Ordinary least square:

None


Probabilities that GCOS criteria is met:

Weighted least square:

None %

Ordinary least square:

None %


Temporal anomaly analyis

The variance of the temporal anomalies provides an additional measure about the stability of the signal AFTER removal of the mean seasonal cylce.

+000 deg


+057/+063 deg