DRAGON_PLATTEVILLE


Location

lon / lat [deg]: -104.7261 / 40.1828

Source network: AERONET


Geostationary surface albedo (GSA) data


“+000”


“+057/+063”


Landcover information (based on ESA CCI landcover data)


Landcover fractions @ 2km distance


Landcover fractions @ 20 km distance


Legend


Distance to open water bodies [km]:

7.48

Distance to urban areas [km]:

7.23


Radius: 1 km

Number of landcover classes:

1

Dominant landcover type:

130: grassland

Fraction of dominant landcover type [%]:

100.0


Radius: 2 km

Number of landcover classes:

1

Dominant landcover type:

130: grassland

Fraction of dominant landcover type [%]:

100.0


Radius: 5 km

Number of landcover classes:

3

Dominant landcover type:

130: grassland

Fraction of dominant landcover type [%]:

84.0


Radius: 10 km

Number of landcover classes:

4

Dominant landcover type:

130: grassland

Fraction of dominant landcover type [%]:

67.0


Radius: 20 km

Number of landcover classes:

4

Dominant landcover type:

130: grassland

Fraction of dominant landcover type [%]:

61.0


Disturbances


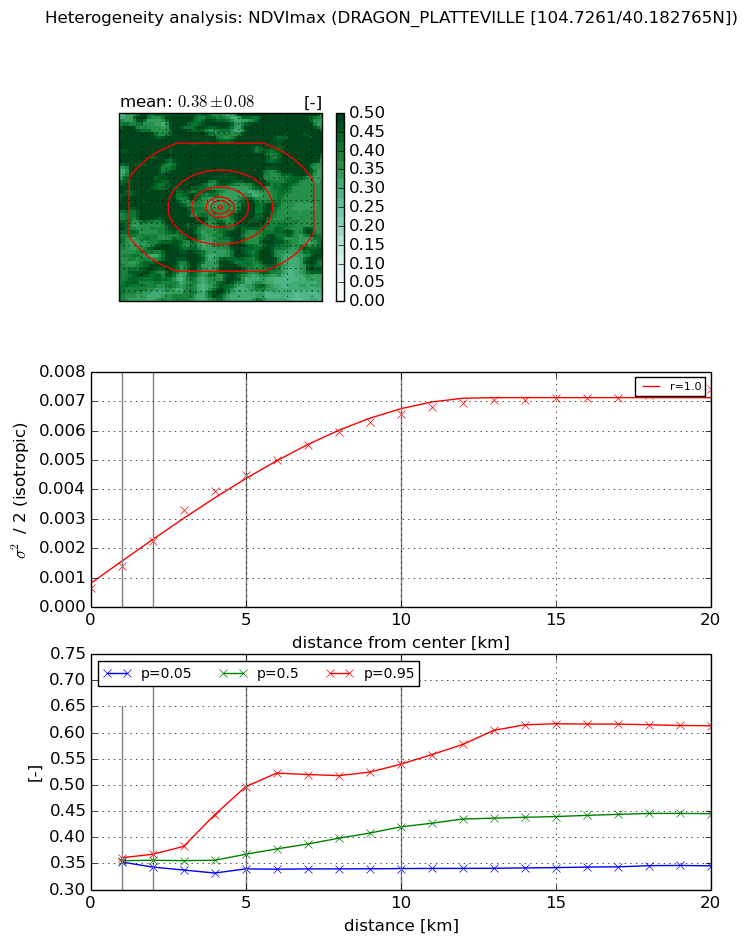
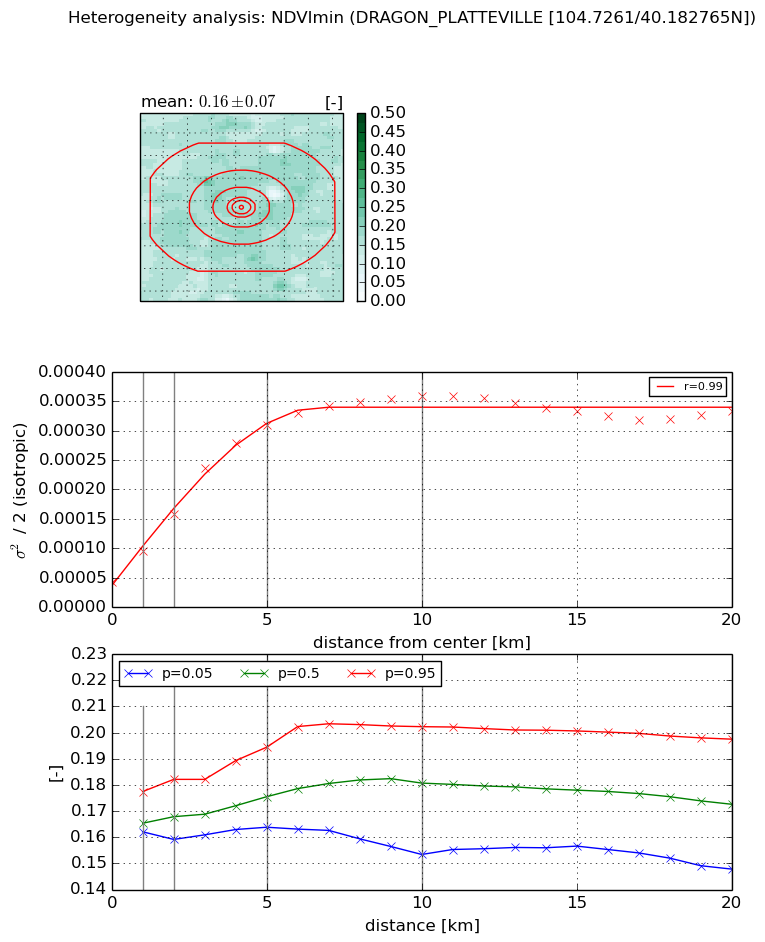
Heterogeneity analysis

The heterogeneity analysis provides information about the spatial and temporal heterogeneity of the site.

Topography


Roman et al. (2009) index


St

5.4951278236

Rcv

0.336520651562

Rse

0.0

Rst

-0.0413677432181

Rsv

0.168049770137


Height range @ 1km [m]

25

Height range @ 2km [m]

39

Height range @ 5km [m]

57

Height range @ 10km [m]

-999

Height range @ 20km [m]

-999


Variance slope @ 1 km

53

Variance slope @ 2 km

77

Variance slope @ 5 km

95

Variance slope @ 10 km

-999

Variance slope @ 20 km

-999


NDVI (max. NDVI composite)


Roman et al. (2009) index


St

1.5152509825

Rcv

1.27238519066

Rse

0.0

Rst

-5.88599659562e-08

Rsv

-0.707484775079


NDVI range @ 1km [-]

0.01

NDVI range @ 2km [-]

0.02

NDVI range @ 5km [-]

0.16

NDVI range @ 10km [-]

0.2

NDVI range @ 20km [-]

0.27


Variance slope @ 1 km

0.000774206752208

Variance slope @ 2 km

0.000804293222846

Variance slope @ 5 km

0.000799932552353

Variance slope @ 10 km

0.000598821731311

Variance slope @ 20 km

0.000304410735802


NDVI (min. NDVI composite)I


Roman et al. (2009) index


St

2.61064102323

Rcv

0.460176159129

Rse

0.0

Rst

0.386787660353

Rsv

-0.302179235155


NDVI range @ 1km [-]

0.02

NDVI range @ 2km [-]

0.02

NDVI range @ 5km [-]

0.03

NDVI range @ 10km [-]

0.05

NDVI range @ 20km [-]

0.05


NDVI slope @ 1 km

5.28862627595e-05

NDVI slope @ 2 km

5.74230489627e-05

NDVI slope @ 5 km

5.60790729898e-05

NDVI slope @ 10 km

3.13135394038e-05

NDVI slope @ 20 km

9.47305472095e-06


Temporal stability analysis

+000 deg (BHR)


BHR statistics

Temporal stability [1/decade]:


abs

rel


Weighted least square:

None


Ordinary least square:

None


Probabilities that GCOS criteria is met:

Weighted least square:

None %

Ordinary least square:

None %


DHR statistics

Temporal stability [1/decade]:


abs

rel


Weighted least square:

None


Ordinary least square:

None


Probabilities that GCOS criteria is met:

Weighted least square:

None %

Ordinary least square:

None %


+057/+063 deg (BHR)


BHR statistics

Temporal stability [1/decade]:


abs

rel


Weighted least square:

None


Ordinary least square:

None


Probabilities that GCOS criteria is met:

Weighted least square:

None %

Ordinary least square:

None %


DHR statistics

Temporal stability [1/decade]:


abs

rel


Weighted least square:

None


Ordinary least square:

None


Probabilities that GCOS criteria is met:

Weighted least square:

None %

Ordinary least square:

None %


Temporal anomaly analyis

The variance of the temporal anomalies provides an additional measure about the stability of the signal AFTER removal of the mean seasonal cylce.

+000 deg


+057/+063 deg