DRAGON_SPBRK


Location

lon / lat [deg]: -77.0058 / 39.0581

Source network: AERONET


Geostationary surface albedo (GSA) data


“+000”


“+057/+063”


Landcover information (based on ESA CCI landcover data)


Landcover fractions @ 2km distance


Landcover fractions @ 20 km distance


Legend


Distance to open water bodies [km]:

8.87

Distance to urban areas [km]:

0.16


Radius: 1 km

Number of landcover classes:

2

Dominant landcover type:

190: urban areas

Fraction of dominant landcover type [%]:

98.0


Radius: 2 km

Number of landcover classes:

2

Dominant landcover type:

190: urban areas

Fraction of dominant landcover type [%]:

96.0


Radius: 5 km

Number of landcover classes:

3

Dominant landcover type:

190: urban areas

Fraction of dominant landcover type [%]:

97.0


Radius: 10 km

Number of landcover classes:

3

Dominant landcover type:

190: urban areas

Fraction of dominant landcover type [%]:

82.0


Radius: 20 km

Number of landcover classes:

5

Dominant landcover type:

190: urban areas

Fraction of dominant landcover type [%]:

69.0


Disturbances


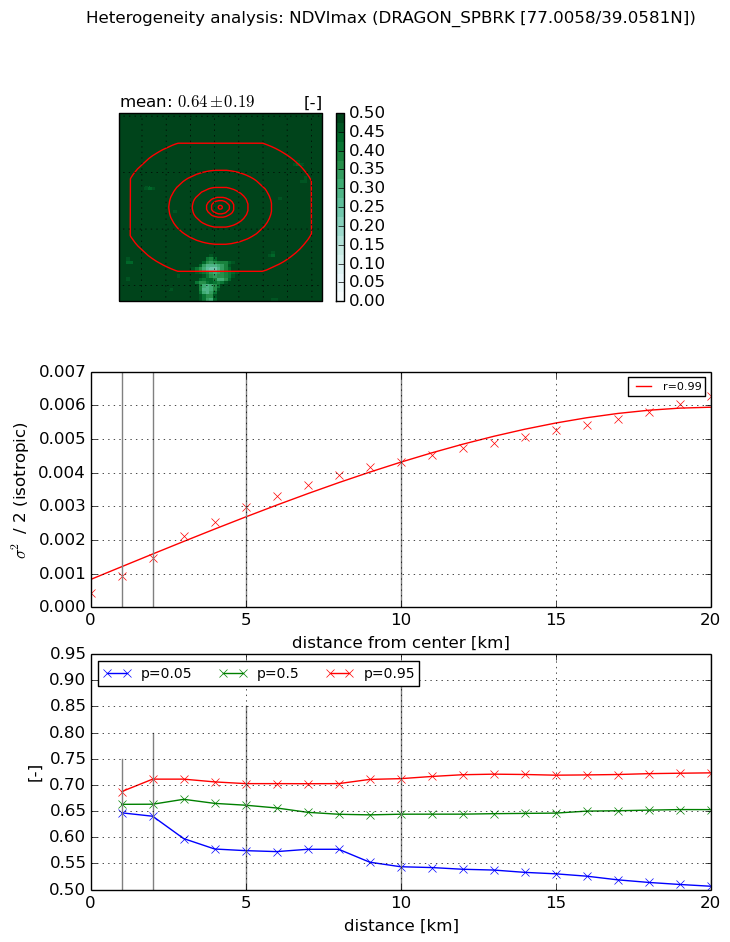
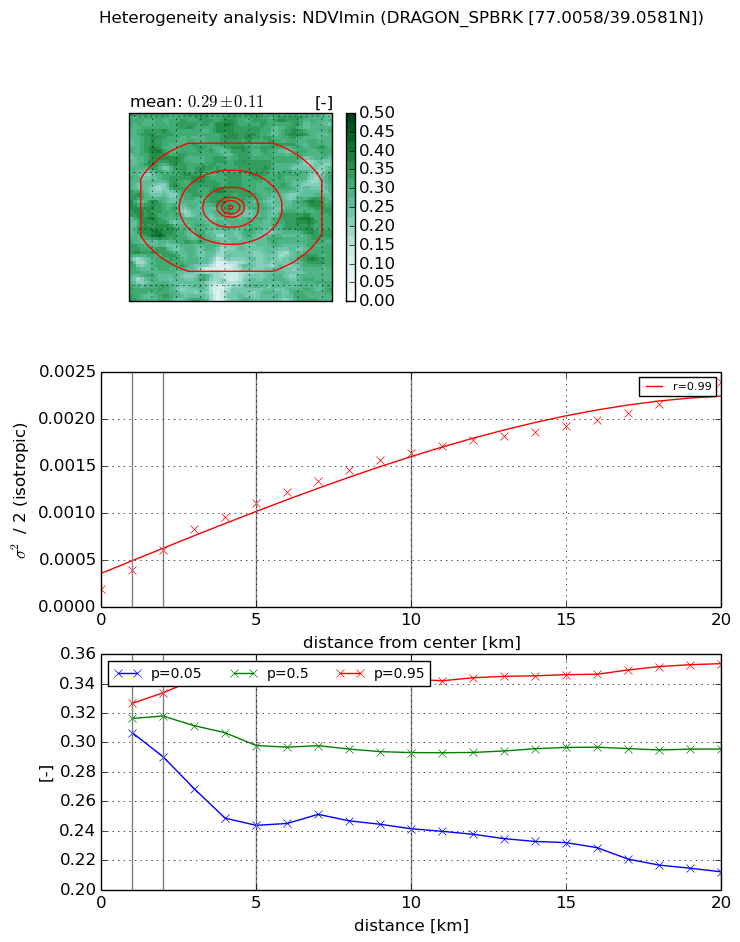
Heterogeneity analysis

The heterogeneity analysis provides information about the spatial and temporal heterogeneity of the site.

Topography


Roman et al. (2009) index


St

2.57883883861

Rcv

0.193664539307

Rse

0.0

Rst

-0.126293169862

Rsv

0.843356552693


Height range @ 1km [m]

30

Height range @ 2km [m]

37

Height range @ 5km [m]

53

Height range @ 10km [m]

-999

Height range @ 20km [m]

-999


Variance slope @ 1 km

103

Variance slope @ 2 km

92

Variance slope @ 5 km

57

Variance slope @ 10 km

-999

Variance slope @ 20 km

-999


NDVI (max. NDVI composite)


Roman et al. (2009) index


St

7.94378676678

Rcv

0.350654646766

Rse

0.0

Rst

-0.0180755116033

Rsv

0.00892348315931


NDVI range @ 1km [-]

0.04

NDVI range @ 2km [-]

0.07

NDVI range @ 5km [-]

0.13

NDVI range @ 10km [-]

0.17

NDVI range @ 20km [-]

0.22


Variance slope @ 1 km

0.000497688197457

Variance slope @ 2 km

0.000517482884872

Variance slope @ 5 km

0.000519529092691

Variance slope @ 10 km

0.000396598307912

Variance slope @ 20 km

0.000266754877031


NDVI (min. NDVI composite)I


Roman et al. (2009) index


St

2.50707662075

Rcv

0.263397518353

Rse

0.0

Rst

-0.367427664744

Rsv

0.565787626885


NDVI range @ 1km [-]

0.02

NDVI range @ 2km [-]

0.04

NDVI range @ 5km [-]

0.1

NDVI range @ 10km [-]

0.1

NDVI range @ 20km [-]

0.14


NDVI slope @ 1 km

0.000203779471944

NDVI slope @ 2 km

0.00020878753473

NDVI slope @ 5 km

0.000184855943715

NDVI slope @ 10 km

0.000143092908795

NDVI slope @ 20 km

9.75635634034e-05


Temporal stability analysis

+000 deg (BHR)


BHR statistics

Temporal stability [1/decade]:


abs

rel


Weighted least square:

-99999.0


Ordinary least square:

-99999.0


Probabilities that GCOS criteria is met:

Weighted least square:

-99999.0 %

Ordinary least square:

-99999.0 %


DHR statistics

Temporal stability [1/decade]:


abs

rel


Weighted least square:

-99999.0


Ordinary least square:

-99999.0


Probabilities that GCOS criteria is met:

Weighted least square:

-99999.0 %

Ordinary least square:

-99999.0 %


+057/+063 deg (BHR)


BHR statistics

Temporal stability [1/decade]:


abs

rel


Weighted least square:

None


Ordinary least square:

None


Probabilities that GCOS criteria is met:

Weighted least square:

None %

Ordinary least square:

None %


DHR statistics

Temporal stability [1/decade]:


abs

rel


Weighted least square:

None


Ordinary least square:

None


Probabilities that GCOS criteria is met:

Weighted least square:

None %

Ordinary least square:

None %


Temporal anomaly analyis

The variance of the temporal anomalies provides an additional measure about the stability of the signal AFTER removal of the mean seasonal cylce.

+000 deg


+057/+063 deg