DRAGON_SQUAW_MTN


Location

lon / lat [deg]: -105.4933 / 39.6797

Source network: AERONET


Geostationary surface albedo (GSA) data


“+000”


“+057/+063”


Landcover information (based on ESA CCI landcover data)


Landcover fractions @ 2km distance


Landcover fractions @ 20 km distance


Legend


Distance to open water bodies [km]:

5.47

Distance to urban areas [km]:

2.17


Radius: 1 km

Number of landcover classes:

1

Dominant landcover type:

70: Tree cover, needleleaved, evergreen, closed to open (>15%)

Fraction of dominant landcover type [%]:

100.0


Radius: 2 km

Number of landcover classes:

1

Dominant landcover type:

70: Tree cover, needleleaved, evergreen, closed to open (>15%)

Fraction of dominant landcover type [%]:

100.0


Radius: 5 km

Number of landcover classes:

2

Dominant landcover type:

70: Tree cover, needleleaved, evergreen, closed to open (>15%)

Fraction of dominant landcover type [%]:

99.0


Radius: 10 km

Number of landcover classes:

3

Dominant landcover type:

70: Tree cover, needleleaved, evergreen, closed to open (>15%)

Fraction of dominant landcover type [%]:

96.0


Radius: 20 km

Number of landcover classes:

3

Dominant landcover type:

70: Tree cover, needleleaved, evergreen, closed to open (>15%)

Fraction of dominant landcover type [%]:

85.0


Disturbances


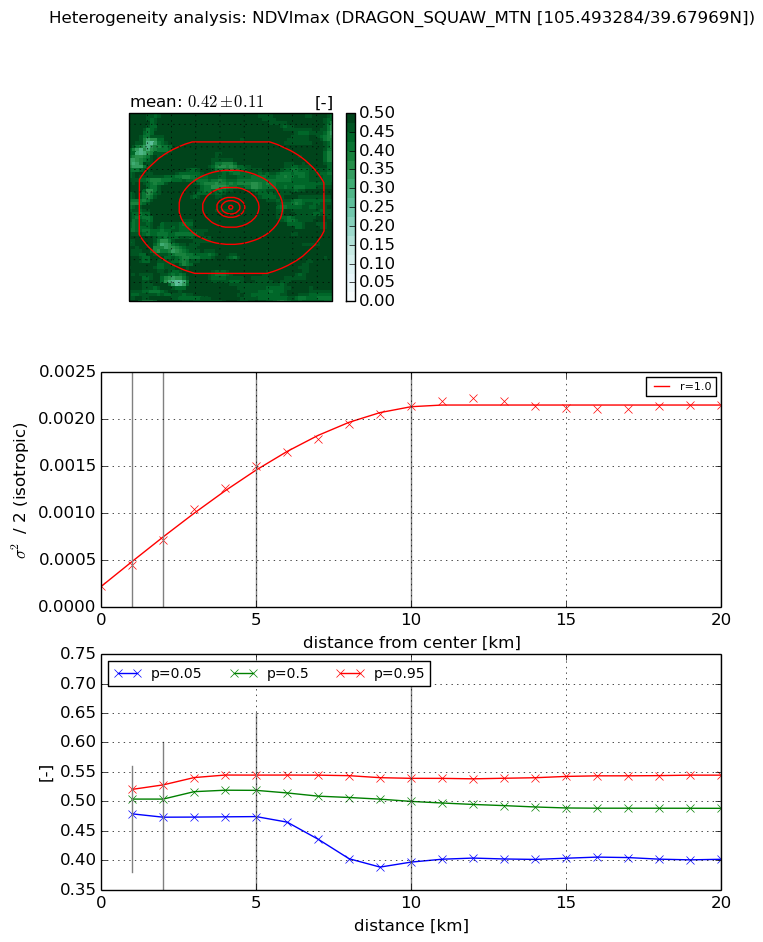
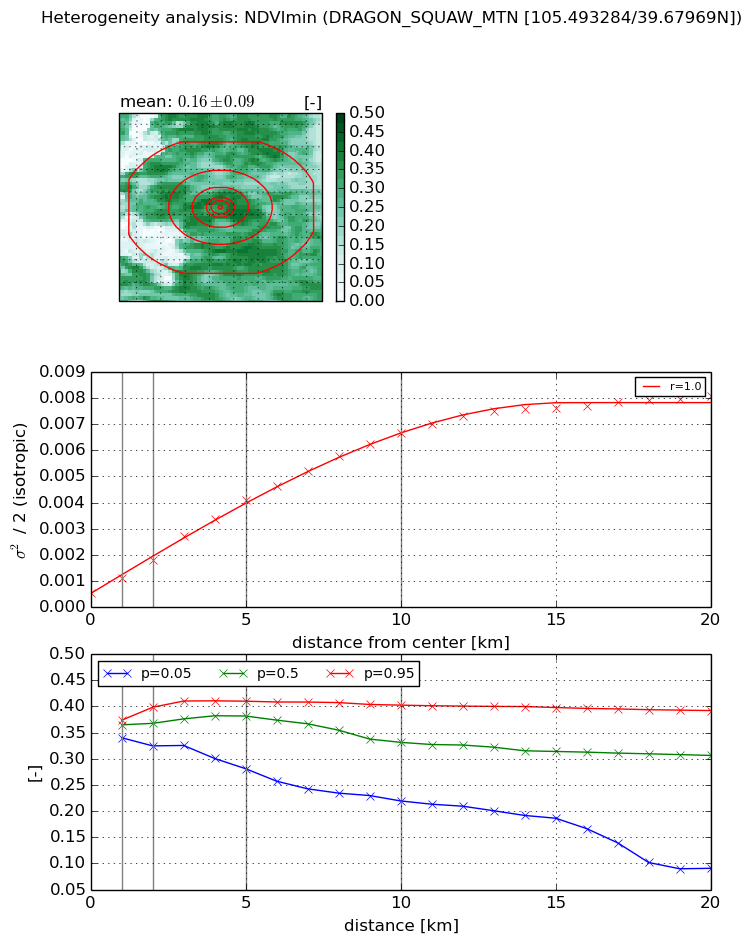
Heterogeneity analysis

The heterogeneity analysis provides information about the spatial and temporal heterogeneity of the site.

Topography


Roman et al. (2009) index


St

5.51905587042

Rcv

0.213182765718

Rse

0.0

Rst

-0.0116488029596

Rsv

0.31873966351


Height range @ 1km [m]

320

Height range @ 2km [m]

485

Height range @ 5km [m]

786

Height range @ 10km [m]

-999

Height range @ 20km [m]

-999


Variance slope @ 1 km

13929

Variance slope @ 2 km

17183

Variance slope @ 5 km

16686

Variance slope @ 10 km

-999

Variance slope @ 20 km

-999


NDVI (max. NDVI composite)


Roman et al. (2009) index


St

5.8231987799

Rcv

0.0474958796247

Rse

0.0

Rst

-0.109862663399

Rsv

0.357822221602


NDVI range @ 1km [-]

0.04

NDVI range @ 2km [-]

0.05

NDVI range @ 5km [-]

0.07

NDVI range @ 10km [-]

0.14

NDVI range @ 20km [-]

0.14


Variance slope @ 1 km

0.000219771260006

Variance slope @ 2 km

0.000244321132504

Variance slope @ 5 km

0.000261974234844

Variance slope @ 10 km

0.000195372050237

Variance slope @ 20 km

8.476432032e-05


NDVI (min. NDVI composite)I


Roman et al. (2009) index


St

1.24169518044

Rcv

0.501941987658

Rse

0.0

Rst

-0.342330805585

Rsv

1.57177910681


NDVI range @ 1km [-]

0.03

NDVI range @ 2km [-]

0.07

NDVI range @ 5km [-]

0.13

NDVI range @ 10km [-]

0.18

NDVI range @ 20km [-]

0.3


NDVI slope @ 1 km

0.000569331901569

NDVI slope @ 2 km

0.000636720191207

NDVI slope @ 5 km

0.000723754758282

NDVI slope @ 10 km

0.000627682219758

NDVI slope @ 20 km

0.000373472332495


Temporal stability analysis

+000 deg (BHR)


BHR statistics

Temporal stability [1/decade]:


abs

rel


Weighted least square:

None


Ordinary least square:

None


Probabilities that GCOS criteria is met:

Weighted least square:

None %

Ordinary least square:

None %


DHR statistics

Temporal stability [1/decade]:


abs

rel


Weighted least square:

None


Ordinary least square:

None


Probabilities that GCOS criteria is met:

Weighted least square:

None %

Ordinary least square:

None %


+057/+063 deg (BHR)


BHR statistics

Temporal stability [1/decade]:


abs

rel


Weighted least square:

None


Ordinary least square:

None


Probabilities that GCOS criteria is met:

Weighted least square:

None %

Ordinary least square:

None %


DHR statistics

Temporal stability [1/decade]:


abs

rel


Weighted least square:

None


Ordinary least square:

None


Probabilities that GCOS criteria is met:

Weighted least square:

None %

Ordinary least square:

None %


Temporal anomaly analyis

The variance of the temporal anomalies provides an additional measure about the stability of the signal AFTER removal of the mean seasonal cylce.

+000 deg


+057/+063 deg