DRAGON_UH_W_LIBERTY


Location

lon / lat [deg]: -94.9781 / 30.0583

Source network: AERONET


Geostationary surface albedo (GSA) data


“+000”


“+057/+063”


Landcover information (based on ESA CCI landcover data)


Landcover fractions @ 2km distance


Landcover fractions @ 20 km distance


Legend


Distance to open water bodies [km]:

5.26

Distance to urban areas [km]:

7.14


Radius: 1 km

Number of landcover classes:

1

Dominant landcover type:

130: grassland

Fraction of dominant landcover type [%]:

100.0


Radius: 2 km

Number of landcover classes:

3

Dominant landcover type:

130: grassland

Fraction of dominant landcover type [%]:

95.0


Radius: 5 km

Number of landcover classes:

6

Dominant landcover type:

130: grassland

Fraction of dominant landcover type [%]:

90.0


Radius: 10 km

Number of landcover classes:

11

Dominant landcover type:

130: grassland

Fraction of dominant landcover type [%]:

69.0


Radius: 20 km

Number of landcover classes:

11

Dominant landcover type:

130: grassland

Fraction of dominant landcover type [%]:

38.0


Disturbances


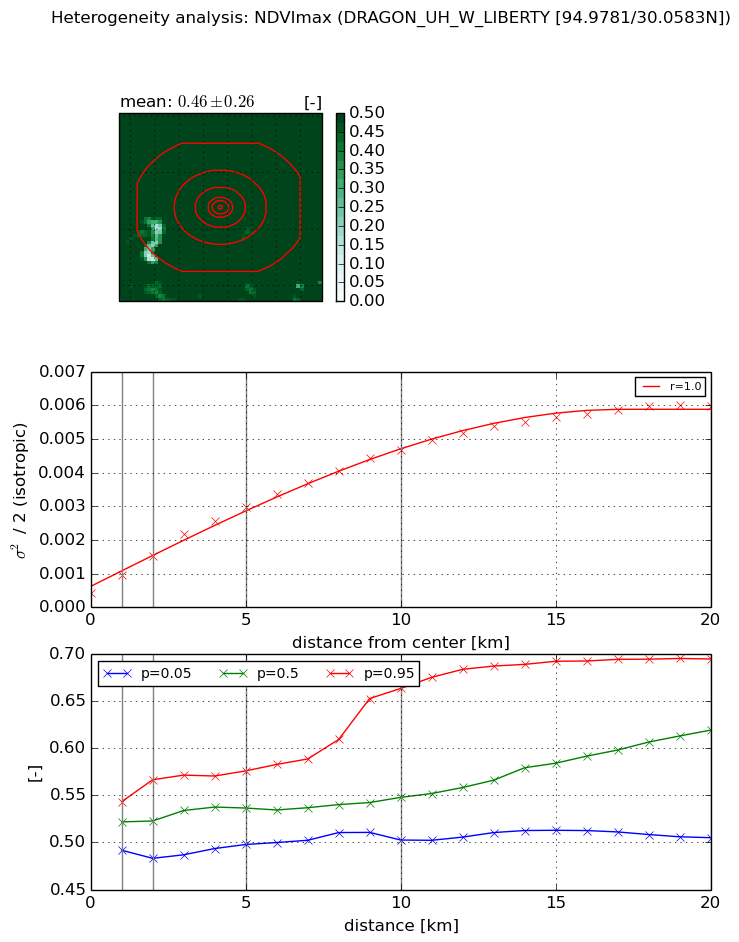
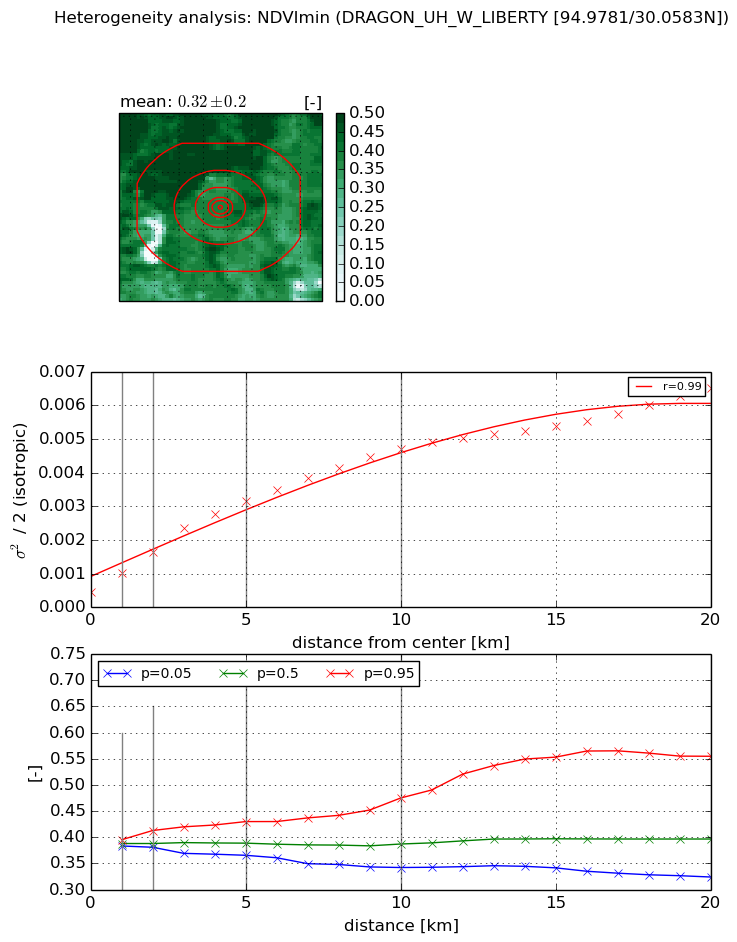
Heterogeneity analysis

The heterogeneity analysis provides information about the spatial and temporal heterogeneity of the site.

Topography


Roman et al. (2009) index


St

4.37214417066

Rcv

0.158489588005

Rse

0.0

Rst

-0.194387906852

Rsv

-0.333284690765


Height range @ 1km [m]

3

Height range @ 2km [m]

3

Height range @ 5km [m]

6

Height range @ 10km [m]

-999

Height range @ 20km [m]

-999


Variance slope @ 1 km

1

Variance slope @ 2 km

1

Variance slope @ 5 km

0

Variance slope @ 10 km

-999

Variance slope @ 20 km

-999


NDVI (max. NDVI composite)


Roman et al. (2009) index


St

17.8470898152

Rcv

-0.0948971632659

Rse

0.0

Rst

0.0325000458841

Rsv

0.0406974231439


NDVI range @ 1km [-]

0.05

NDVI range @ 2km [-]

0.08

NDVI range @ 5km [-]

0.08

NDVI range @ 10km [-]

0.16

NDVI range @ 20km [-]

0.19


Variance slope @ 1 km

0.000554938982258

Variance slope @ 2 km

0.000554823103351

Variance slope @ 5 km

0.000525277191397

Variance slope @ 10 km

0.000424657078782

Variance slope @ 20 km

0.00027478411082


NDVI (min. NDVI composite)I


Roman et al. (2009) index


St

2.69032696488

Rcv

0.324156277965

Rse

0.0

Rst

-0.0317195486846

Rsv

0.759230269808


NDVI range @ 1km [-]

0.01

NDVI range @ 2km [-]

0.03

NDVI range @ 5km [-]

0.06

NDVI range @ 10km [-]

0.13

NDVI range @ 20km [-]

0.23


NDVI slope @ 1 km

0.000589648046786

NDVI slope @ 2 km

0.000599498311025

NDVI slope @ 5 km

0.000558006859153

NDVI slope @ 10 km

0.000421403187157

NDVI slope @ 20 km

0.000270044457958


Temporal stability analysis

+000 deg (BHR)


BHR statistics

Temporal stability [1/decade]:


abs

rel


Weighted least square:

None


Ordinary least square:

None


Probabilities that GCOS criteria is met:

Weighted least square:

None %

Ordinary least square:

None %


DHR statistics

Temporal stability [1/decade]:


abs

rel


Weighted least square:

None


Ordinary least square:

None


Probabilities that GCOS criteria is met:

Weighted least square:

None %

Ordinary least square:

None %


+057/+063 deg (BHR)


BHR statistics

Temporal stability [1/decade]:


abs

rel


Weighted least square:

None


Ordinary least square:

None


Probabilities that GCOS criteria is met:

Weighted least square:

None %

Ordinary least square:

None %


DHR statistics

Temporal stability [1/decade]:


abs

rel


Weighted least square:

None


Ordinary least square:

None


Probabilities that GCOS criteria is met:

Weighted least square:

None %

Ordinary least square:

None %


Temporal anomaly analyis

The variance of the temporal anomalies provides an additional measure about the stability of the signal AFTER removal of the mean seasonal cylce.

+000 deg


+057/+063 deg