DRAGON_WELCH


Location

lon / lat [deg]: -105.1395 / 39.6388

Source network: AERONET


Geostationary surface albedo (GSA) data


“+000”


“+057/+063”


Landcover information (based on ESA CCI landcover data)


Landcover fractions @ 2km distance


Landcover fractions @ 20 km distance


Legend


Distance to open water bodies [km]:

1.14

Distance to urban areas [km]:

0.16


Radius: 1 km

Number of landcover classes:

2

Dominant landcover type:

130: grassland

Fraction of dominant landcover type [%]:

51.0


Radius: 2 km

Number of landcover classes:

3

Dominant landcover type:

190: urban areas

Fraction of dominant landcover type [%]:

49.0


Radius: 5 km

Number of landcover classes:

3

Dominant landcover type:

190: urban areas

Fraction of dominant landcover type [%]:

62.0


Radius: 10 km

Number of landcover classes:

4

Dominant landcover type:

190: urban areas

Fraction of dominant landcover type [%]:

57.0


Radius: 20 km

Number of landcover classes:

4

Dominant landcover type:

190: urban areas

Fraction of dominant landcover type [%]:

50.0


Disturbances


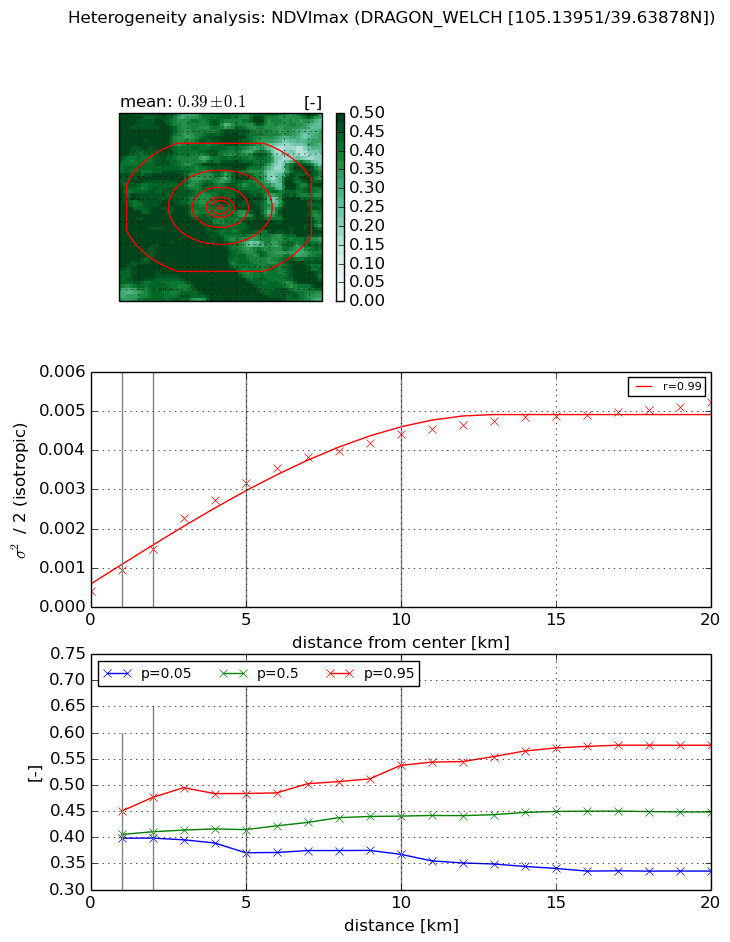
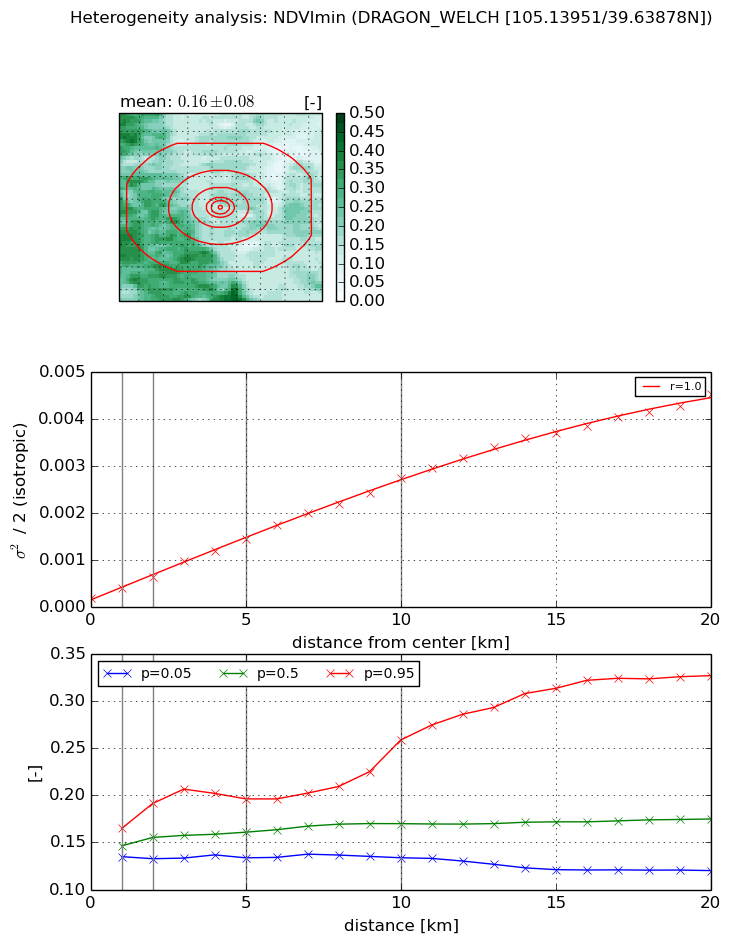
Heterogeneity analysis

The heterogeneity analysis provides information about the spatial and temporal heterogeneity of the site.

Topography


Roman et al. (2009) index


St

1.38181280973

Rcv

0.694393855793

Rse

0.0

Rst

1.96498805134e-07

Rsv

1.47666701971


Height range @ 1km [m]

47

Height range @ 2km [m]

72

Height range @ 5km [m]

193

Height range @ 10km [m]

-999

Height range @ 20km [m]

-999


Variance slope @ 1 km

894

Variance slope @ 2 km

838

Variance slope @ 5 km

996

Variance slope @ 10 km

-999

Variance slope @ 20 km

-999


NDVI (max. NDVI composite)


Roman et al. (2009) index


St

11.4626887436

Rcv

0.0923883775137

Rse

0.0

Rst

-0.0707706042649

Rsv

0.098559718528


NDVI range @ 1km [-]

0.05

NDVI range @ 2km [-]

0.08

NDVI range @ 5km [-]

0.11

NDVI range @ 10km [-]

0.17

NDVI range @ 20km [-]

0.24


Variance slope @ 1 km

0.000515934503026

Variance slope @ 2 km

0.000532753230504

Variance slope @ 5 km

0.000567856877081

Variance slope @ 10 km

0.000403285311953

Variance slope @ 20 km

0.000213042224701


NDVI (min. NDVI composite)I


Roman et al. (2009) index


St

11.0081889971

Rcv

-0.059318191553

Rse

0.0

Rst

0.15493722501

Rsv

-0.0582689742148


NDVI range @ 1km [-]

0.03

NDVI range @ 2km [-]

0.06

NDVI range @ 5km [-]

0.06

NDVI range @ 10km [-]

0.13

NDVI range @ 20km [-]

0.21


NDVI slope @ 1 km

0.000218203762405

NDVI slope @ 2 km

0.000227381910838

NDVI slope @ 5 km

0.000257430349877

NDVI slope @ 10 km

0.000254794732178

NDVI slope @ 20 km

0.000219447299296


Temporal stability analysis

+000 deg (BHR)


BHR statistics

Temporal stability [1/decade]:


abs

rel


Weighted least square:

None


Ordinary least square:

None


Probabilities that GCOS criteria is met:

Weighted least square:

None %

Ordinary least square:

None %


DHR statistics

Temporal stability [1/decade]:


abs

rel


Weighted least square:

None


Ordinary least square:

None


Probabilities that GCOS criteria is met:

Weighted least square:

None %

Ordinary least square:

None %


+057/+063 deg (BHR)


BHR statistics

Temporal stability [1/decade]:


abs

rel


Weighted least square:

None


Ordinary least square:

None


Probabilities that GCOS criteria is met:

Weighted least square:

None %

Ordinary least square:

None %


DHR statistics

Temporal stability [1/decade]:


abs

rel


Weighted least square:

None


Ordinary least square:

None


Probabilities that GCOS criteria is met:

Weighted least square:

None %

Ordinary least square:

None %


Temporal anomaly analyis

The variance of the temporal anomalies provides an additional measure about the stability of the signal AFTER removal of the mean seasonal cylce.

+000 deg


+057/+063 deg