EL_FARAFRA


Location

lon / lat [deg]: 27.9902 / 27.058

Source network: AERONET


Geostationary surface albedo (GSA) data


“+000”


“+057/+063”


Landcover information (based on ESA CCI landcover data)


Landcover fractions @ 2km distance


Landcover fractions @ 20 km distance


Legend


Distance to open water bodies [km]:

26.17

Distance to urban areas [km]:

7.88


Radius: 1 km

Number of landcover classes:

1

Dominant landcover type:

200: bare areas

Fraction of dominant landcover type [%]:

100.0


Radius: 2 km

Number of landcover classes:

1

Dominant landcover type:

200: bare areas

Fraction of dominant landcover type [%]:

100.0


Radius: 5 km

Number of landcover classes:

2

Dominant landcover type:

200: bare areas

Fraction of dominant landcover type [%]:

96.0


Radius: 10 km

Number of landcover classes:

3

Dominant landcover type:

200: bare areas

Fraction of dominant landcover type [%]:

91.0


Radius: 20 km

Number of landcover classes:

2

Dominant landcover type:

200: bare areas

Fraction of dominant landcover type [%]:

93.0


Disturbances


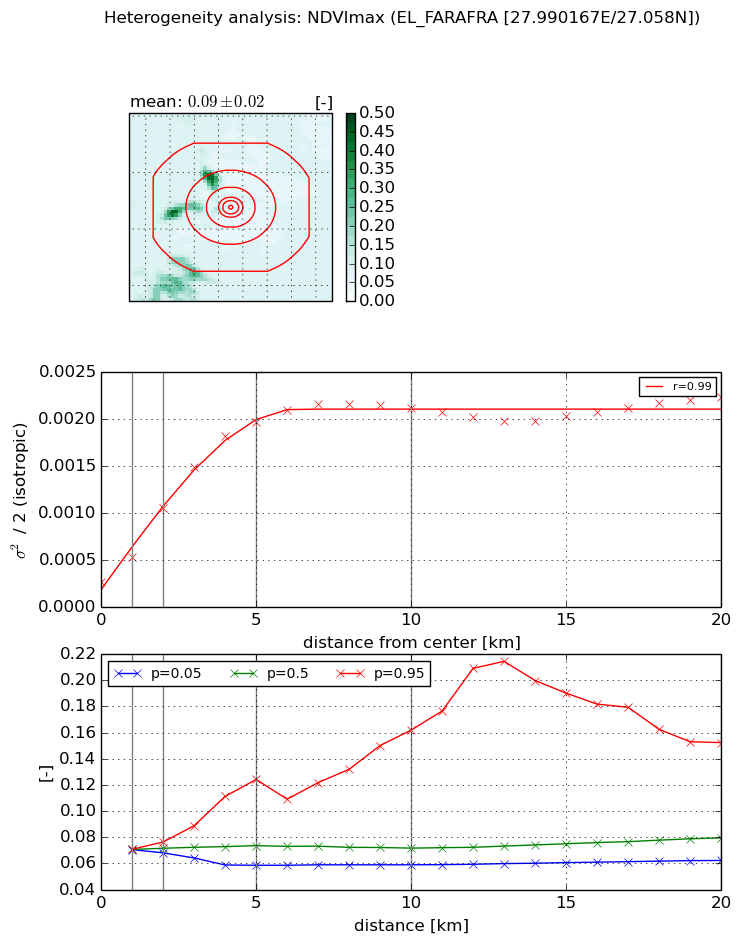
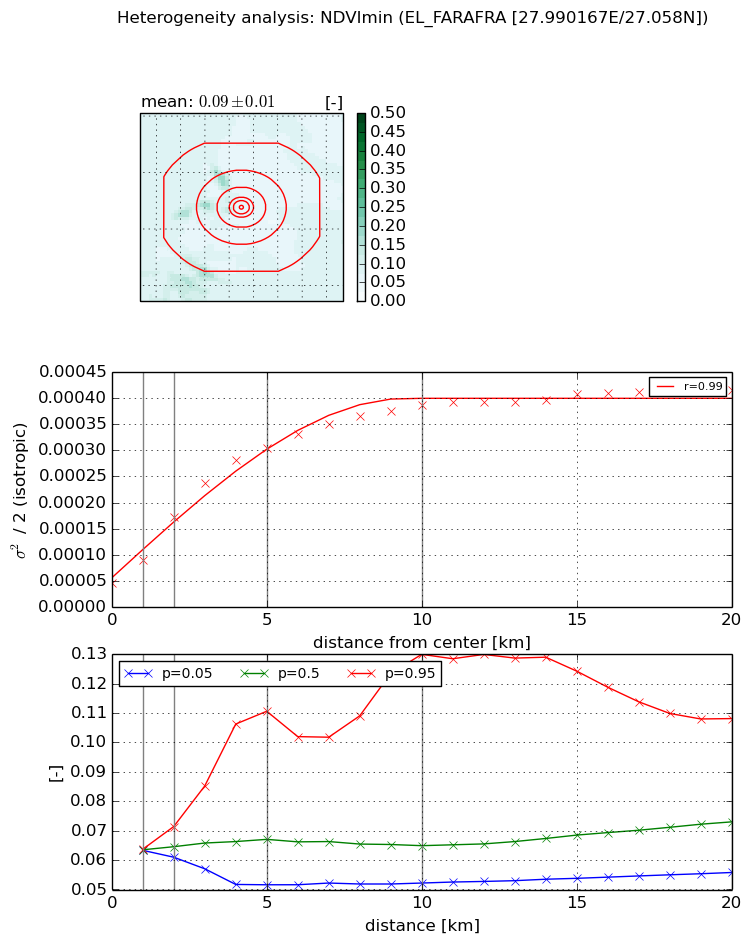
Heterogeneity analysis

The heterogeneity analysis provides information about the spatial and temporal heterogeneity of the site.

Topography


Roman et al. (2009) index


St

0.00868930720713

Rcv

0.650326196899

Rse

0.0

Rst

-5.50671606578e-07

Rsv

344.601593629


Height range @ 1km [m]

13

Height range @ 2km [m]

11

Height range @ 5km [m]

22

Height range @ 10km [m]

-999

Height range @ 20km [m]

-999


Variance slope @ 1 km

14

Variance slope @ 2 km

12

Variance slope @ 5 km

9

Variance slope @ 10 km

-999

Variance slope @ 20 km

-999


NDVI (max. NDVI composite)


Roman et al. (2009) index


St

1.34257468726

Rcv

1.31855244399

Rse

0.0

Rst

-0.0904130466403

Rsv

0.825547068304


NDVI range @ 1km [-]

0.0

NDVI range @ 2km [-]

0.01

NDVI range @ 5km [-]

0.07

NDVI range @ 10km [-]

0.1

NDVI range @ 20km [-]

0.09


Variance slope @ 1 km

0.000264254688538

Variance slope @ 2 km

0.000392235721494

Variance slope @ 5 km

0.000366409087645

Variance slope @ 10 km

0.000187931511434

Variance slope @ 20 km

6.30130364873e-05


NDVI (min. NDVI composite)I


Roman et al. (2009) index


St

1.47925549735

Rcv

0.958242410664

Rse

0.0

Rst

-0.0313847625838

Rsv

1.03842004738


NDVI range @ 1km [-]

0.0

NDVI range @ 2km [-]

0.01

NDVI range @ 5km [-]

0.06

NDVI range @ 10km [-]

0.08

NDVI range @ 20km [-]

0.05


NDVI slope @ 1 km

4.34620050197e-05

NDVI slope @ 2 km

6.29871451989e-05

NDVI slope @ 5 km

5.51950225971e-05

NDVI slope @ 10 km

3.3586492919e-05

NDVI slope @ 20 km

1.49009418447e-05


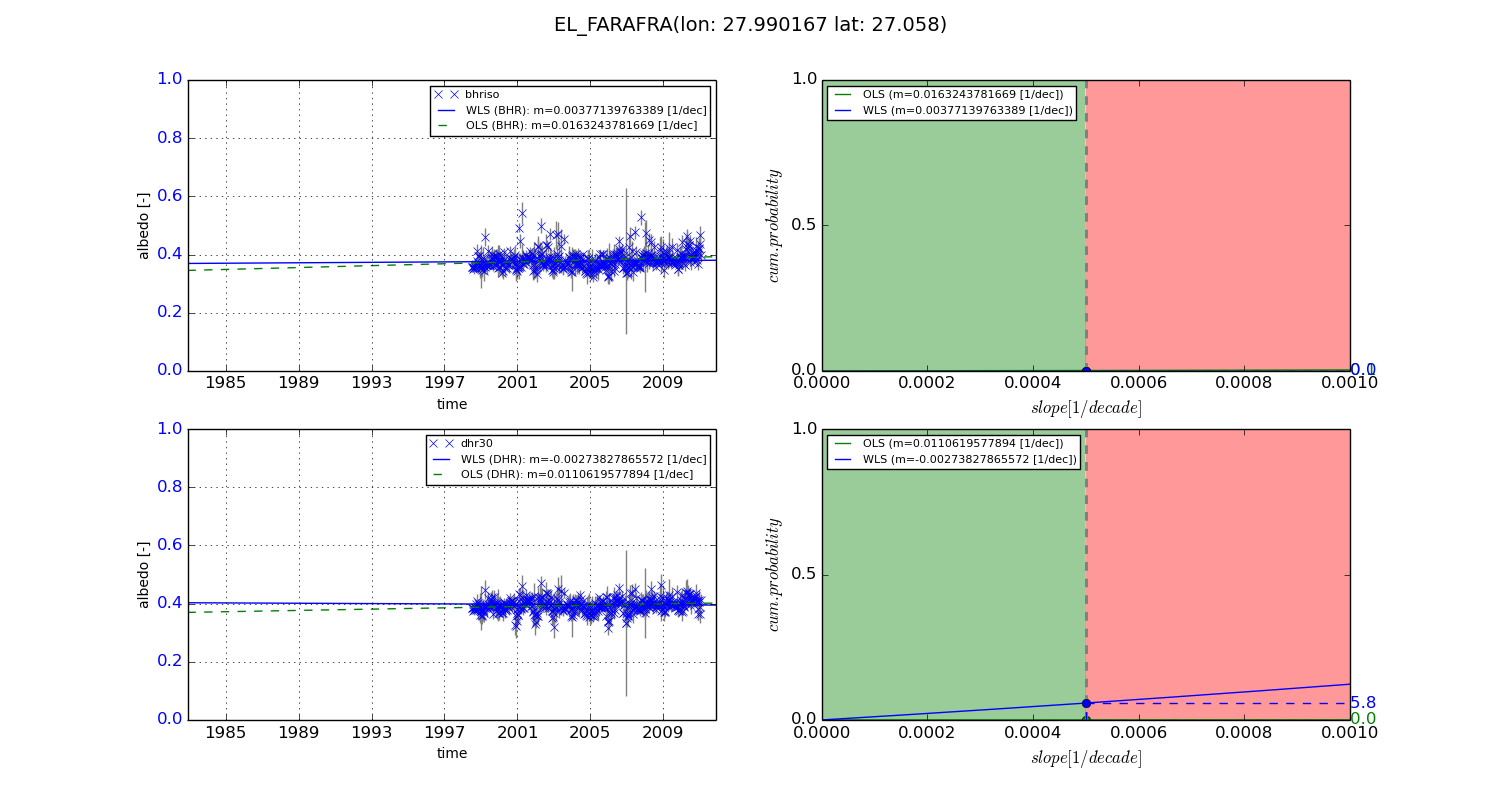
Temporal stability analysis

+000 deg (BHR)


BHR statistics

Temporal stability [1/decade]:


abs

rel


Weighted least square:

0.0237952880166


Ordinary least square:

0.0193910491159


Probabilities that GCOS criteria is met:

Weighted least square:

1.7 %

Ordinary least square:

1.2 %


DHR statistics

Temporal stability [1/decade]:


abs

rel


Weighted least square:

0.0235426703329


Ordinary least square:

0.0153612769744


Probabilities that GCOS criteria is met:

Weighted least square:

1.6 %

Ordinary least square:

1.0 %


+057/+063 deg (BHR)


BHR statistics

Temporal stability [1/decade]:


abs

rel


Weighted least square:

0.00377139763389


Ordinary least square:

0.0163243781669


Probabilities that GCOS criteria is met:

Weighted least square:

0.0 %

Ordinary least square:

0.1 %


DHR statistics

Temporal stability [1/decade]:


abs

rel


Weighted least square:

-0.00273827865572


Ordinary least square:

0.0110619577894


Probabilities that GCOS criteria is met:

Weighted least square:

5.8 %

Ordinary least square:

0.0 %


Temporal anomaly analyis

The variance of the temporal anomalies provides an additional measure about the stability of the signal AFTER removal of the mean seasonal cylce.

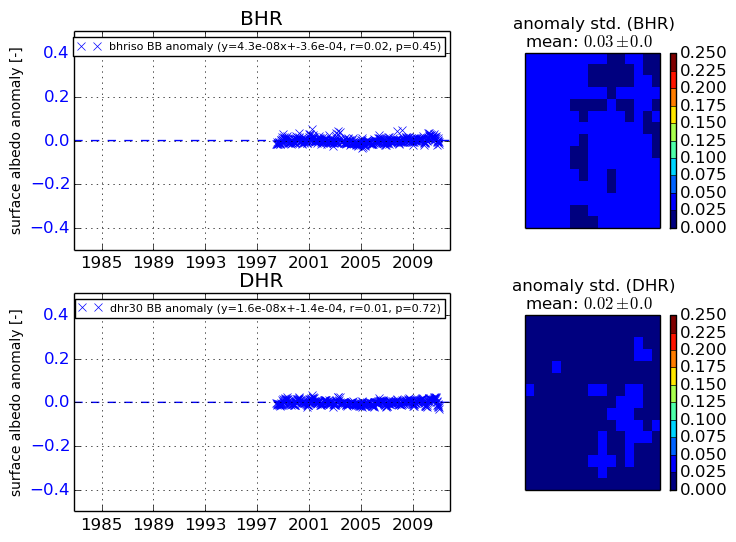
+000 deg


+057/+063 deg