FI-SOD


Location

lon / lat [deg]: 26.6378 / 67.3619

Source network: FLUXNET


Geostationary surface albedo (GSA) data


“+000”


“+057/+063”


Landcover information (based on ESA CCI landcover data)


Landcover fractions @ 2km distance


Landcover fractions @ 20 km distance


Legend


Distance to open water bodies [km]:

0.26

Distance to urban areas [km]:

2.92


Radius: 1 km

Number of landcover classes:

4

Dominant landcover type:

70: Tree cover, needleleaved, evergreen, closed to open (>15%)

Fraction of dominant landcover type [%]:

66.0


Radius: 2 km

Number of landcover classes:

6

Dominant landcover type:

70: Tree cover, needleleaved, evergreen, closed to open (>15%)

Fraction of dominant landcover type [%]:

64.0


Radius: 5 km

Number of landcover classes:

6

Dominant landcover type:

70: Tree cover, needleleaved, evergreen, closed to open (>15%)

Fraction of dominant landcover type [%]:

70.0


Radius: 10 km

Number of landcover classes:

7

Dominant landcover type:

70: Tree cover, needleleaved, evergreen, closed to open (>15%)

Fraction of dominant landcover type [%]:

74.0


Radius: 20 km

Number of landcover classes:

6

Dominant landcover type:

70: Tree cover, needleleaved, evergreen, closed to open (>15%)

Fraction of dominant landcover type [%]:

74.0


Disturbances


Heterogeneity analysis

The heterogeneity analysis provides information about the spatial and temporal heterogeneity of the site.

Topography


Roman et al. (2009) index


St

1.87464984035e-05

Rcv

0.307225108106

Rse

0.0

Rst

0.0468259788226

Rsv

160029.53182


Height range @ 1km [m]

11

Height range @ 2km [m]

12

Height range @ 5km [m]

47

Height range @ 10km [m]

-999

Height range @ 20km [m]

-999


Variance slope @ 1 km

57

Variance slope @ 2 km

67

Variance slope @ 5 km

56

Variance slope @ 10 km

-999

Variance slope @ 20 km

-999


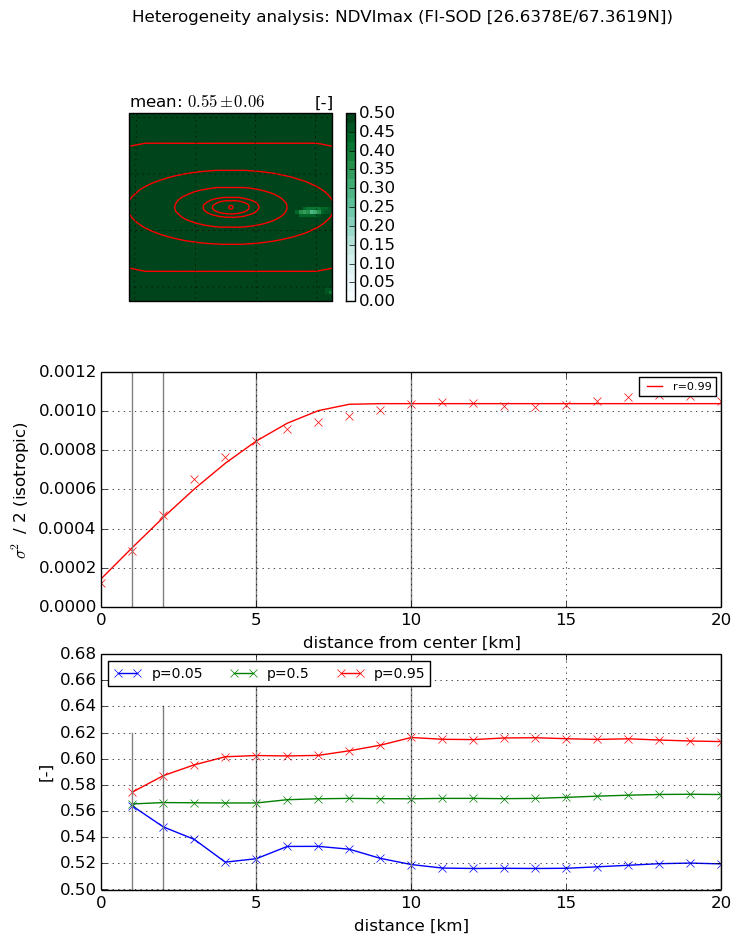
NDVI (max. NDVI composite)


Roman et al. (2009) index


St

2.97761453722

Rcv

0.339059605239

Rse

0.0

Rst

-0.116601582497

Rsv

0.551856730551


NDVI range @ 1km [-]

0.01

NDVI range @ 2km [-]

0.04

NDVI range @ 5km [-]

0.08

NDVI range @ 10km [-]

0.1

NDVI range @ 20km [-]

0.09


Variance slope @ 1 km

0.000163904725929

Variance slope @ 2 km

0.000173409462341

Variance slope @ 5 km

0.000150535601067

Variance slope @ 10 km

8.83027356909e-05

Variance slope @ 20 km

3.59365376847e-05


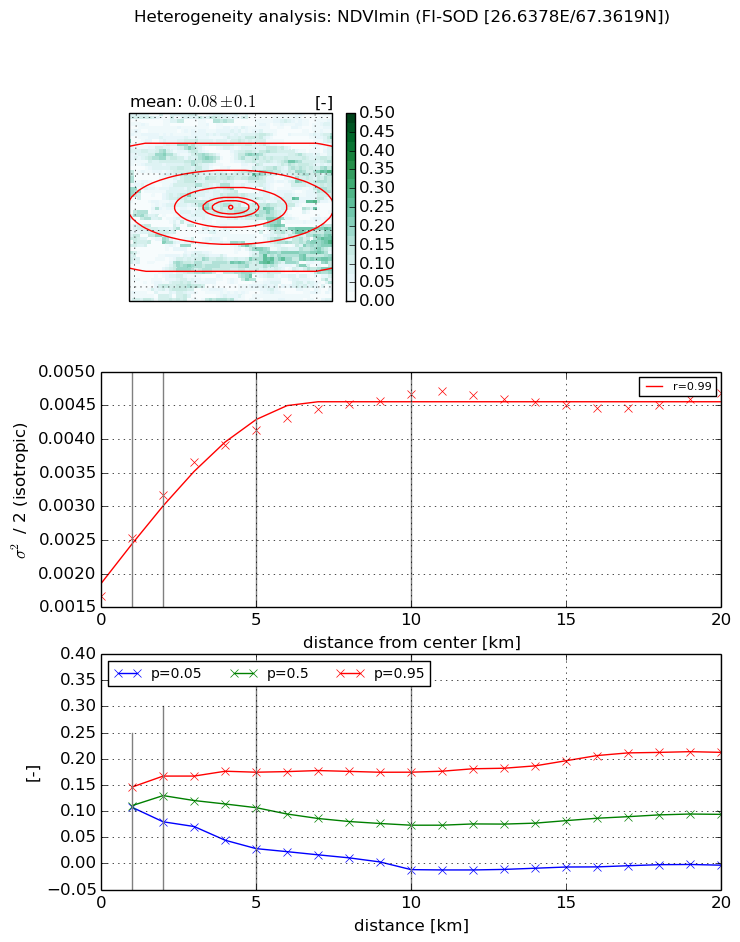
NDVI (min. NDVI composite)I


Roman et al. (2009) index


St

0.956039200747

Rcv

0.633260970114

Rse

0.0

Rst

-0.261904062822

Rsv

2.24278160948


NDVI range @ 1km [-]

0.04

NDVI range @ 2km [-]

0.09

NDVI range @ 5km [-]

0.15

NDVI range @ 10km [-]

0.19

NDVI range @ 20km [-]

0.22


NDVI slope @ 1 km

0.000875908748489

NDVI slope @ 2 km

0.000757835089053

NDVI slope @ 5 km

0.00048551953879

NDVI slope @ 10 km

0.000265558046838

NDVI slope @ 20 km

9.3795340865e-05


Temporal stability analysis

+000 deg (BHR)


BHR statistics

Temporal stability [1/decade]:


abs

rel


Weighted least square:

-99999.0


Ordinary least square:

-99999.0


Probabilities that GCOS criteria is met:

Weighted least square:

-99999.0 %

Ordinary least square:

-99999.0 %


DHR statistics

Temporal stability [1/decade]:


abs

rel


Weighted least square:

-99999.0


Ordinary least square:

-99999.0


Probabilities that GCOS criteria is met:

Weighted least square:

-99999.0 %

Ordinary least square:

-99999.0 %


+057/+063 deg (BHR)


BHR statistics

Temporal stability [1/decade]:


abs

rel


Weighted least square:

-99999.0


Ordinary least square:

-99999.0


Probabilities that GCOS criteria is met:

Weighted least square:

-99999.0 %

Ordinary least square:

-99999.0 %


DHR statistics

Temporal stability [1/decade]:


abs

rel


Weighted least square:

-99999.0


Ordinary least square:

-99999.0


Probabilities that GCOS criteria is met:

Weighted least square:

-99999.0 %

Ordinary least square:

-99999.0 %


Temporal anomaly analyis

The variance of the temporal anomalies provides an additional measure about the stability of the signal AFTER removal of the mean seasonal cylce.

+000 deg


+057/+063 deg