FR-HES


Location

lon / lat [deg]: 7.0646 / 48.6742

Source network: FLUXNET


Geostationary surface albedo (GSA) data


“+000”


“+057/+063”


Landcover information (based on ESA CCI landcover data)


Landcover fractions @ 2km distance


Landcover fractions @ 20 km distance


Legend


Distance to open water bodies [km]:

4.0

Distance to urban areas [km]:

0.87


Radius: 1 km

Number of landcover classes:

4

Dominant landcover type:

60: Tree cover, broadleaved, decidous

Fraction of dominant landcover type [%]:

86.0


Radius: 2 km

Number of landcover classes:

6

Dominant landcover type:

60: Tree cover, broadleaved, decidous

Fraction of dominant landcover type [%]:

58.0


Radius: 5 km

Number of landcover classes:

7

Dominant landcover type:

10: cropland, rainfed

Fraction of dominant landcover type [%]:

33.0


Radius: 10 km

Number of landcover classes:

7

Dominant landcover type:

10: cropland, rainfed

Fraction of dominant landcover type [%]:

22.0


Radius: 20 km

Number of landcover classes:

8

Dominant landcover type:

70: Tree cover, needleleaved, evergreen, closed to open (>15%)

Fraction of dominant landcover type [%]:

26.0


Disturbances


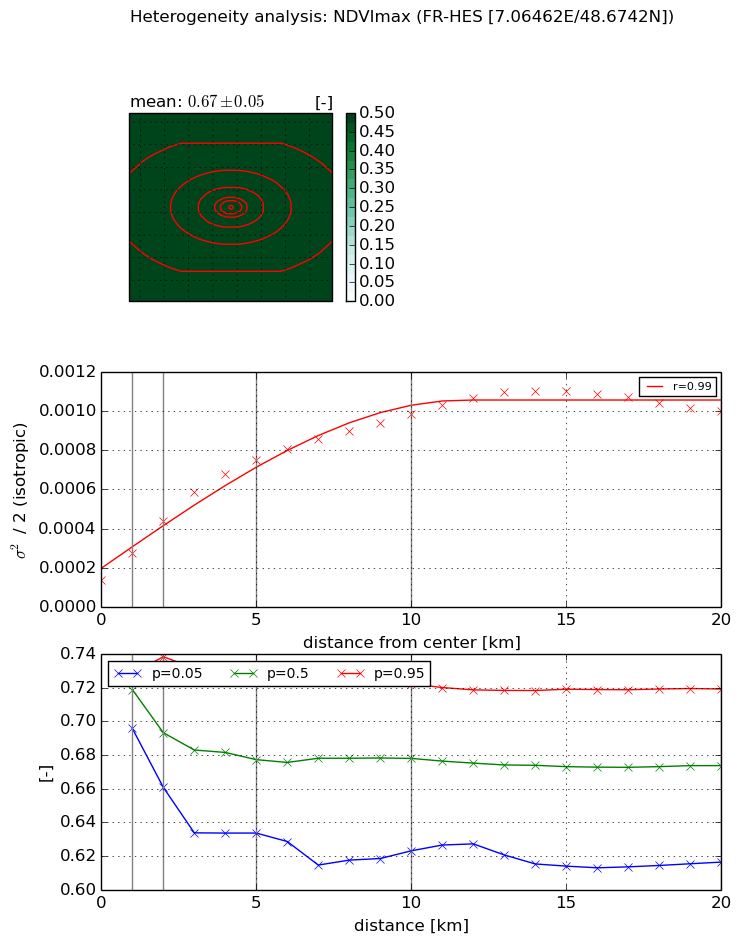
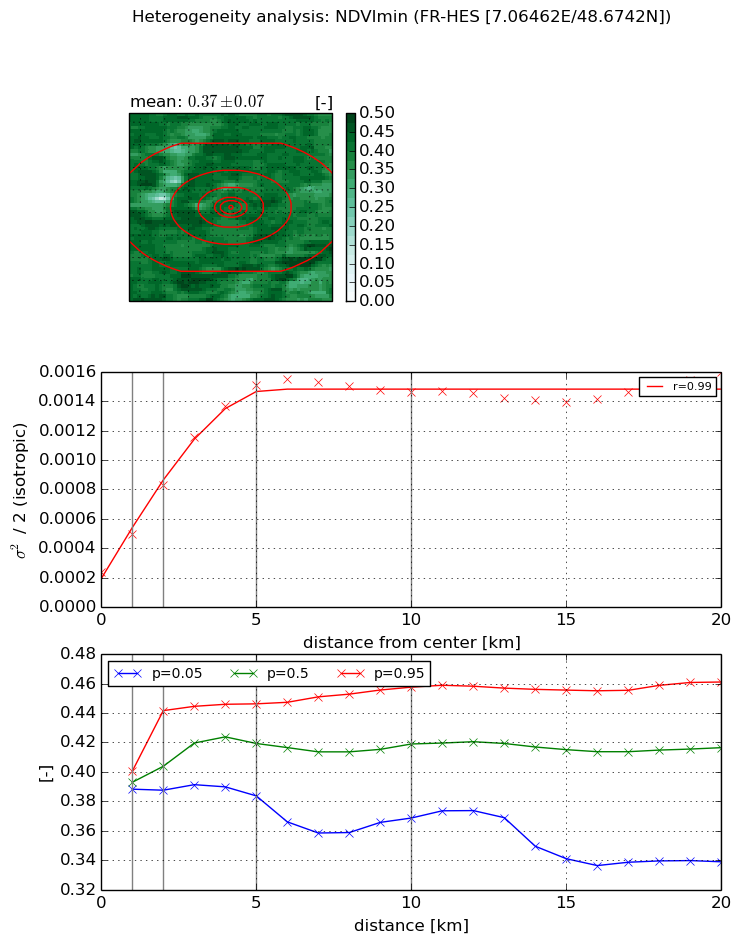
Heterogeneity analysis

The heterogeneity analysis provides information about the spatial and temporal heterogeneity of the site.

Topography


Roman et al. (2009) index


St

2.18845838576

Rcv

0.370827545358

Rse

0.0

Rst

-4.40036668871e-07

Rsv

-0.999999999966


Height range @ 1km [m]

52

Height range @ 2km [m]

53

Height range @ 5km [m]

113

Height range @ 10km [m]

-999

Height range @ 20km [m]

-999


Variance slope @ 1 km

483

Variance slope @ 2 km

319

Variance slope @ 5 km

238

Variance slope @ 10 km

-999

Variance slope @ 20 km

-999


NDVI (max. NDVI composite)


Roman et al. (2009) index


St

4.44277196448

Rcv

0.00437268060846

Rse

0.0

Rst

0.0915194475927

Rsv

0.579361975315


NDVI range @ 1km [-]

0.03

NDVI range @ 2km [-]

0.08

NDVI range @ 5km [-]

0.1

NDVI range @ 10km [-]

0.1

NDVI range @ 20km [-]

0.1


Variance slope @ 1 km

0.000137876978533

Variance slope @ 2 km

0.000151114078744

Variance slope @ 5 km

0.000126622483734

Variance slope @ 10 km

8.14582645239e-05

Variance slope @ 20 km

3.90210231328e-05


NDVI (min. NDVI composite)I


Roman et al. (2009) index


St

nan

Rcv

nan

Rse

nan

Rst

nan

Rsv

nan


NDVI range @ 1km [-]

0.01

NDVI range @ 2km [-]

0.05

NDVI range @ 5km [-]

0.06

NDVI range @ 10km [-]

0.09

NDVI range @ 20km [-]

0.12


NDVI slope @ 1 km

0.000256786919975

NDVI slope @ 2 km

0.000295945824349

NDVI slope @ 5 km

0.000266019101881

NDVI slope @ 10 km

0.000118252261521

NDVI slope @ 20 km

3.79293521241e-05


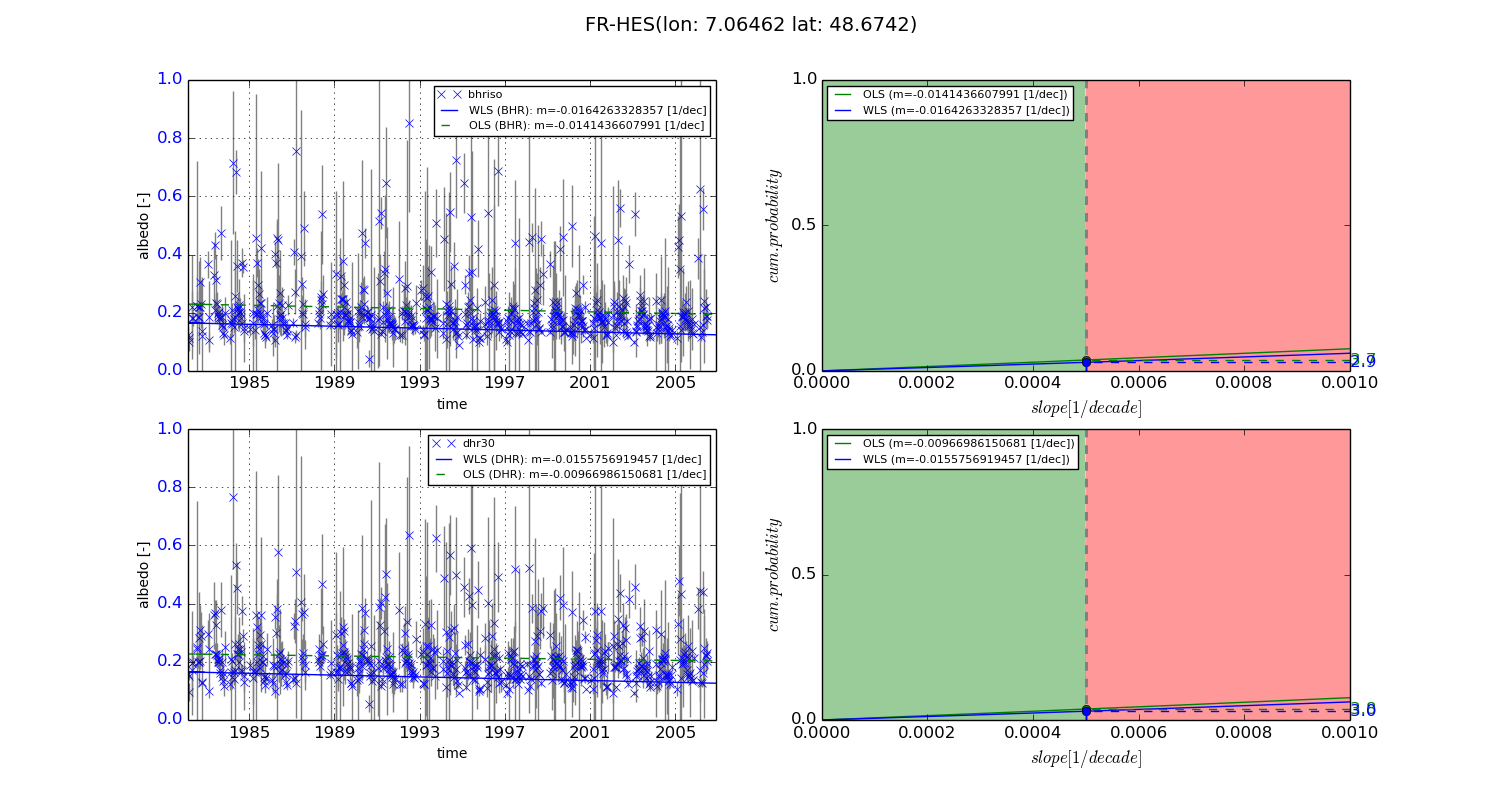
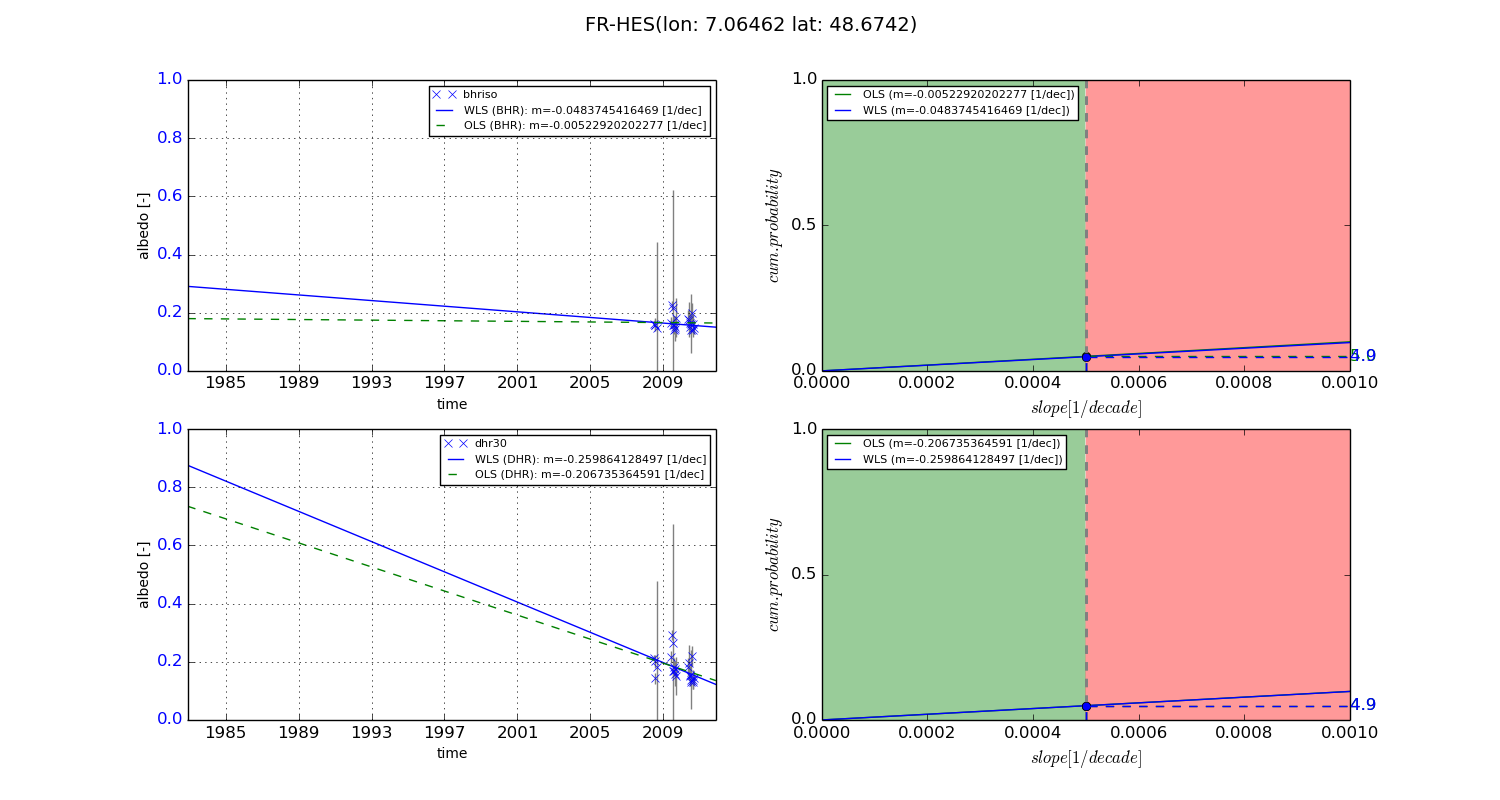
Temporal stability analysis

+000 deg (BHR)


BHR statistics

Temporal stability [1/decade]:


abs

rel


Weighted least square:

-0.0164263328357


Ordinary least square:

-0.0141436607991


Probabilities that GCOS criteria is met:

Weighted least square:

2.9 %

Ordinary least square:

3.7 %


DHR statistics

Temporal stability [1/decade]:


abs

rel


Weighted least square:

-0.0155756919457


Ordinary least square:

-0.00966986150681


Probabilities that GCOS criteria is met:

Weighted least square:

3.0 %

Ordinary least square:

3.8 %


+057/+063 deg (BHR)


BHR statistics

Temporal stability [1/decade]:


abs

rel


Weighted least square:

-0.0483745416469


Ordinary least square:

-0.00522920202277


Probabilities that GCOS criteria is met:

Weighted least square:

4.9 %

Ordinary least square:

5.0 %


DHR statistics

Temporal stability [1/decade]:


abs

rel


Weighted least square:

-0.259864128497


Ordinary least square:

-0.206735364591


Probabilities that GCOS criteria is met:

Weighted least square:

4.9 %

Ordinary least square:

4.9 %


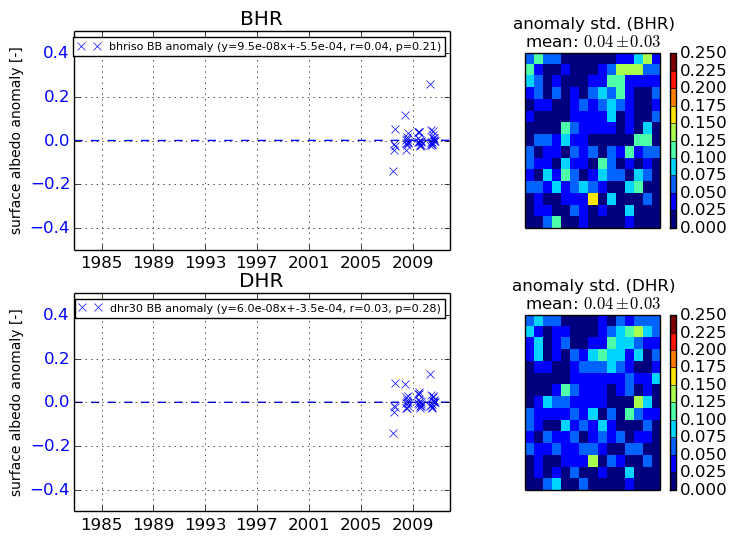
Temporal anomaly analyis

The variance of the temporal anomalies provides an additional measure about the stability of the signal AFTER removal of the mean seasonal cylce.
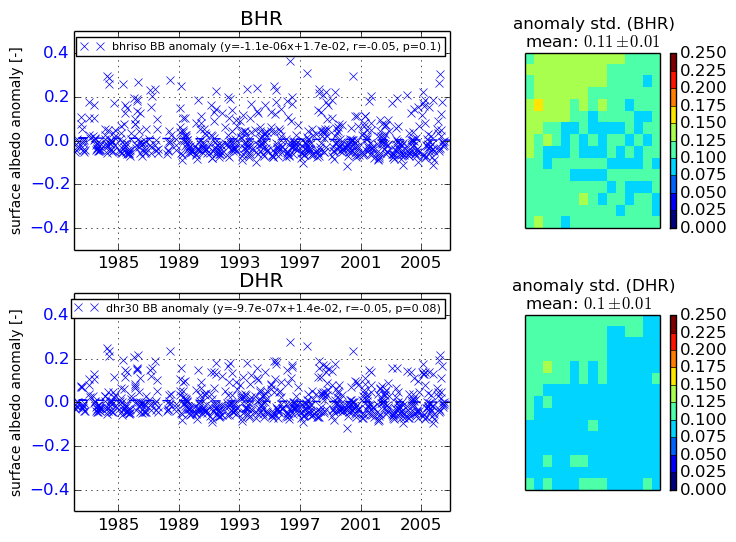
+000 deg


+057/+063 deg