GANDHI_COLLEGE


Location

lon / lat [deg]: 84.1279 / 25.871

Source network: AERONET


Geostationary surface albedo (GSA) data


“+000”


“+057/+063”


Landcover information (based on ESA CCI landcover data)


Landcover fractions @ 2km distance


Landcover fractions @ 20 km distance


Legend


Distance to open water bodies [km]:

1.35

Distance to urban areas [km]:

2.43


Radius: 1 km

Number of landcover classes:

1

Dominant landcover type:

20: cropland, irrigated or post-flooded

Fraction of dominant landcover type [%]:

100.0


Radius: 2 km

Number of landcover classes:

2

Dominant landcover type:

20: cropland, irrigated or post-flooded

Fraction of dominant landcover type [%]:

95.0


Radius: 5 km

Number of landcover classes:

2

Dominant landcover type:

20: cropland, irrigated or post-flooded

Fraction of dominant landcover type [%]:

81.0


Radius: 10 km

Number of landcover classes:

2

Dominant landcover type:

20: cropland, irrigated or post-flooded

Fraction of dominant landcover type [%]:

86.0


Radius: 20 km

Number of landcover classes:

4

Dominant landcover type:

20: cropland, irrigated or post-flooded

Fraction of dominant landcover type [%]:

79.0


Disturbances


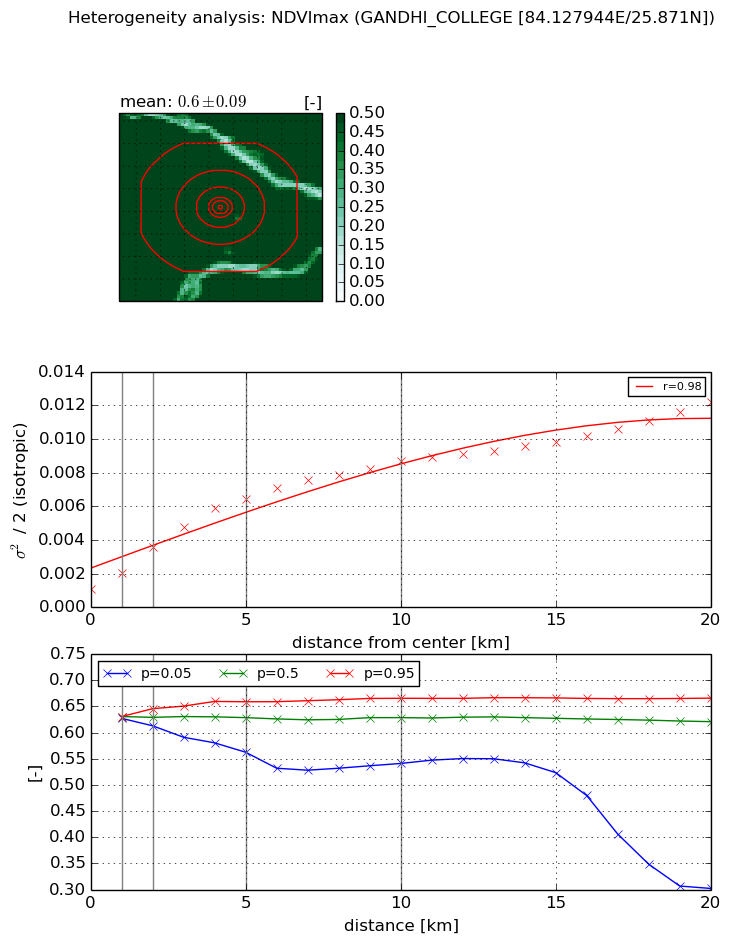
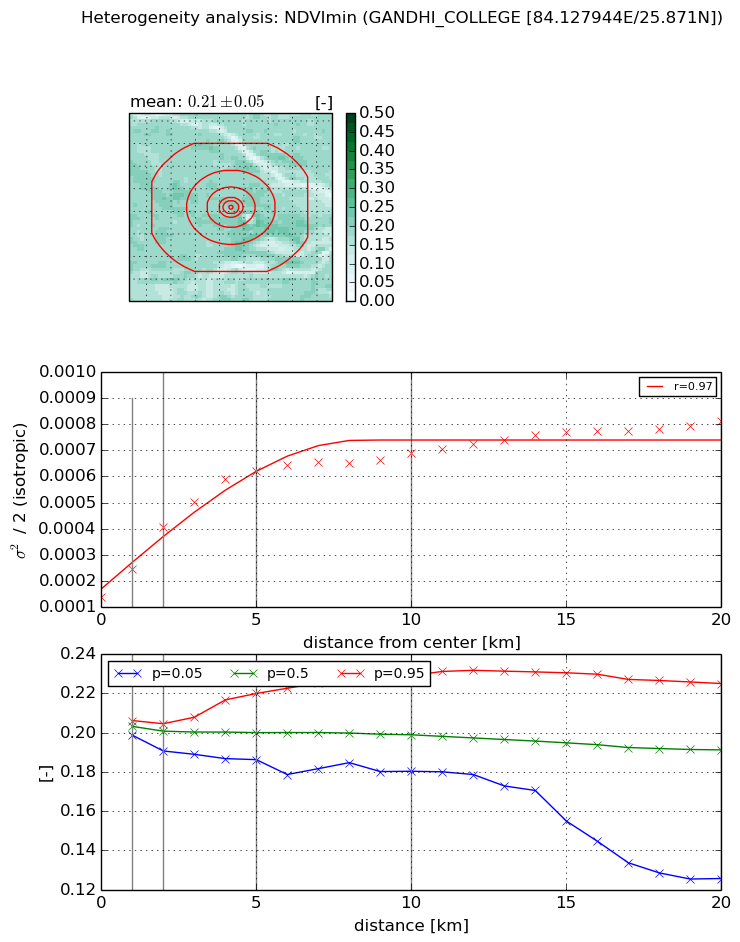
Heterogeneity analysis

The heterogeneity analysis provides information about the spatial and temporal heterogeneity of the site.

Topography


Roman et al. (2009) index


St

5.83087186658e-06

Rcv

0.178570497931

Rse

0.0

Rst

-0.917321011444

Rsv

514501.720951


Height range @ 1km [m]

7

Height range @ 2km [m]

7

Height range @ 5km [m]

8

Height range @ 10km [m]

-999

Height range @ 20km [m]

-999


Variance slope @ 1 km

2

Variance slope @ 2 km

1

Variance slope @ 5 km

0

Variance slope @ 10 km

-999

Variance slope @ 20 km

-999


NDVI (max. NDVI composite)


Roman et al. (2009) index


St

1.16233301809

Rcv

1.30967781805

Rse

0.0

Rst

-0.271338428139

Rsv

-0.999999653143


NDVI range @ 1km [-]

0.0

NDVI range @ 2km [-]

0.03

NDVI range @ 5km [-]

0.1

NDVI range @ 10km [-]

0.12

NDVI range @ 20km [-]

0.36


Variance slope @ 1 km

0.00093948630445

Variance slope @ 2 km

0.00126094870081

Variance slope @ 5 km

0.00113180295651

Variance slope @ 10 km

0.000747066515489

Variance slope @ 20 km

0.000465939577005


NDVI (min. NDVI composite)I


Roman et al. (2009) index


St

1.02700617728

Rcv

1.77260141937

Rse

0.0

Rst

-0.148540163885

Rsv

-0.999970350024


NDVI range @ 1km [-]

0.01

NDVI range @ 2km [-]

0.01

NDVI range @ 5km [-]

0.03

NDVI range @ 10km [-]

0.05

NDVI range @ 20km [-]

0.1


NDVI slope @ 1 km

0.000107968684089

NDVI slope @ 2 km

0.000133129806443

NDVI slope @ 5 km

0.000101138406178

NDVI slope @ 10 km

5.02261326109e-05

NDVI slope @ 20 km

2.50377265731e-05


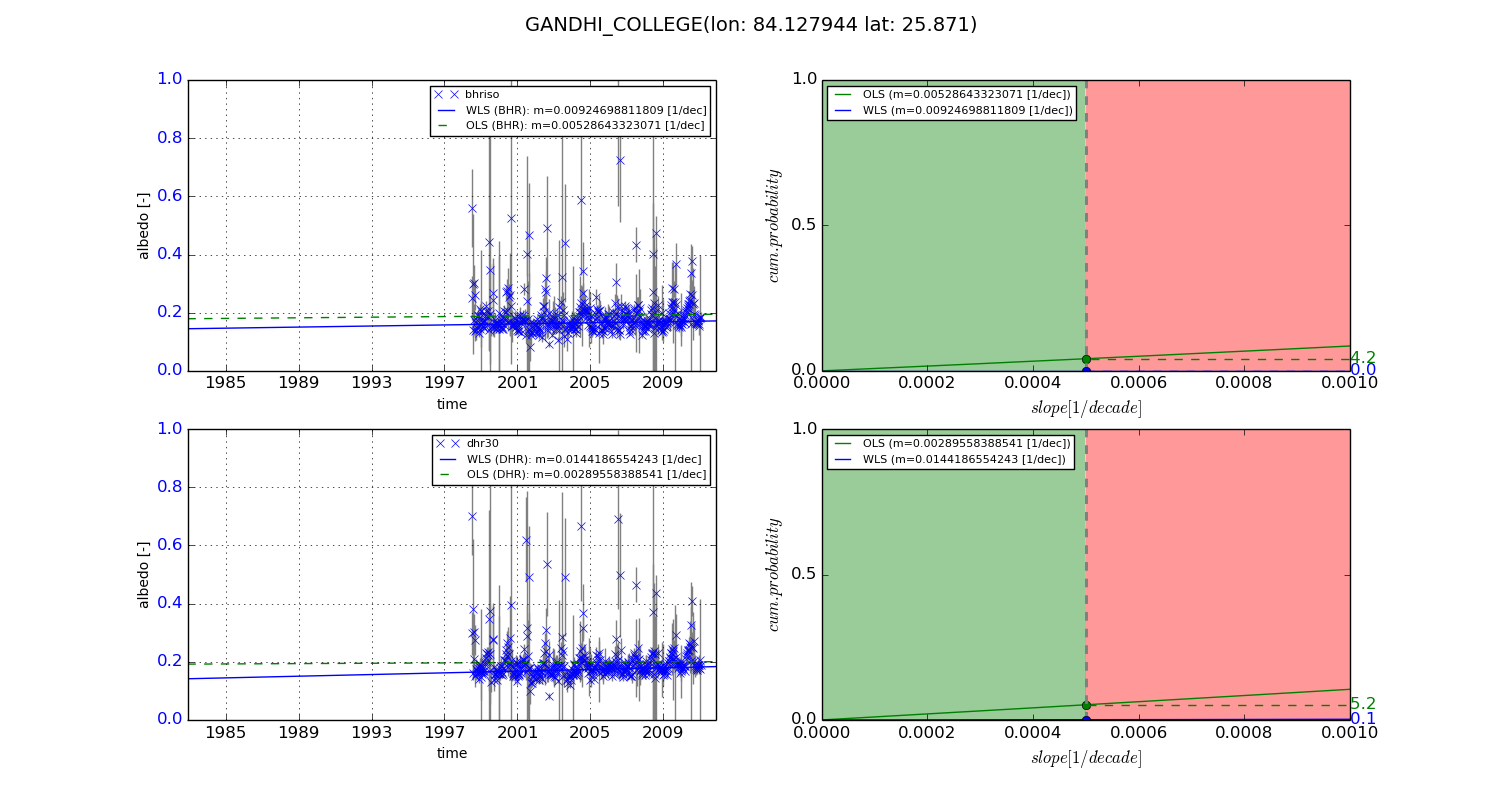
Temporal stability analysis

+000 deg (BHR)


BHR statistics

Temporal stability [1/decade]:


abs

rel


Weighted least square:

None


Ordinary least square:

None


Probabilities that GCOS criteria is met:

Weighted least square:

None %

Ordinary least square:

None %


DHR statistics

Temporal stability [1/decade]:


abs

rel


Weighted least square:

None


Ordinary least square:

None


Probabilities that GCOS criteria is met:

Weighted least square:

None %

Ordinary least square:

None %


+057/+063 deg (BHR)


BHR statistics

Temporal stability [1/decade]:


abs

rel


Weighted least square:

0.00924698811809


Ordinary least square:

0.00528643323071


Probabilities that GCOS criteria is met:

Weighted least square:

0.0 %

Ordinary least square:

4.2 %


DHR statistics

Temporal stability [1/decade]:


abs

rel


Weighted least square:

0.0144186554243


Ordinary least square:

0.00289558388541


Probabilities that GCOS criteria is met:

Weighted least square:

0.1 %

Ordinary least square:

5.2 %


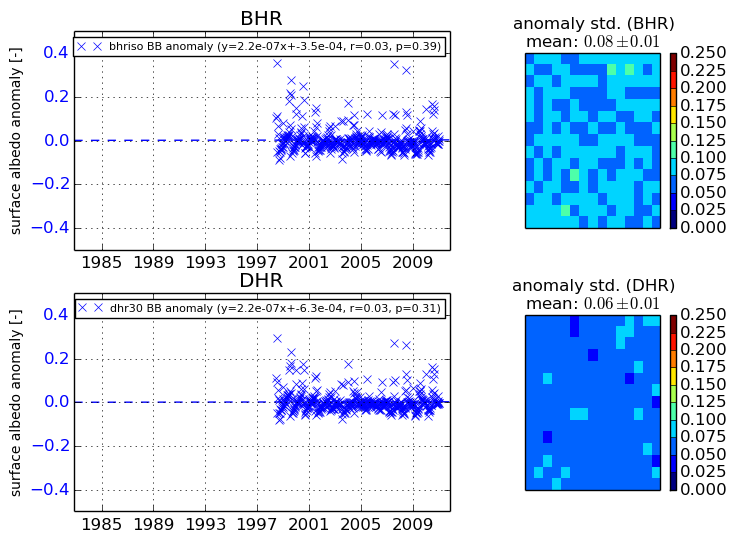
Temporal anomaly analyis

The variance of the temporal anomalies provides an additional measure about the stability of the signal AFTER removal of the mean seasonal cylce.

+000 deg


+057/+063 deg