GERLITZEN


Location

lon / lat [deg]: 13.9067 / 46.6783

Source network: AERONET


Geostationary surface albedo (GSA) data


“+000”


“+057/+063”


Landcover information (based on ESA CCI landcover data)


Landcover fractions @ 2km distance


Landcover fractions @ 20 km distance


Legend


Distance to open water bodies [km]:

1.77

Distance to urban areas [km]:

1.82


Radius: 1 km

Number of landcover classes:

3

Dominant landcover type:

70: Tree cover, needleleaved, evergreen, closed to open (>15%)

Fraction of dominant landcover type [%]:

87.0


Radius: 2 km

Number of landcover classes:

8

Dominant landcover type:

70: Tree cover, needleleaved, evergreen, closed to open (>15%)

Fraction of dominant landcover type [%]:

68.0


Radius: 5 km

Number of landcover classes:

8

Dominant landcover type:

70: Tree cover, needleleaved, evergreen, closed to open (>15%)

Fraction of dominant landcover type [%]:

50.0


Radius: 10 km

Number of landcover classes:

9

Dominant landcover type:

70: Tree cover, needleleaved, evergreen, closed to open (>15%)

Fraction of dominant landcover type [%]:

45.0


Radius: 20 km

Number of landcover classes:

9

Dominant landcover type:

70: Tree cover, needleleaved, evergreen, closed to open (>15%)

Fraction of dominant landcover type [%]:

45.0


Disturbances


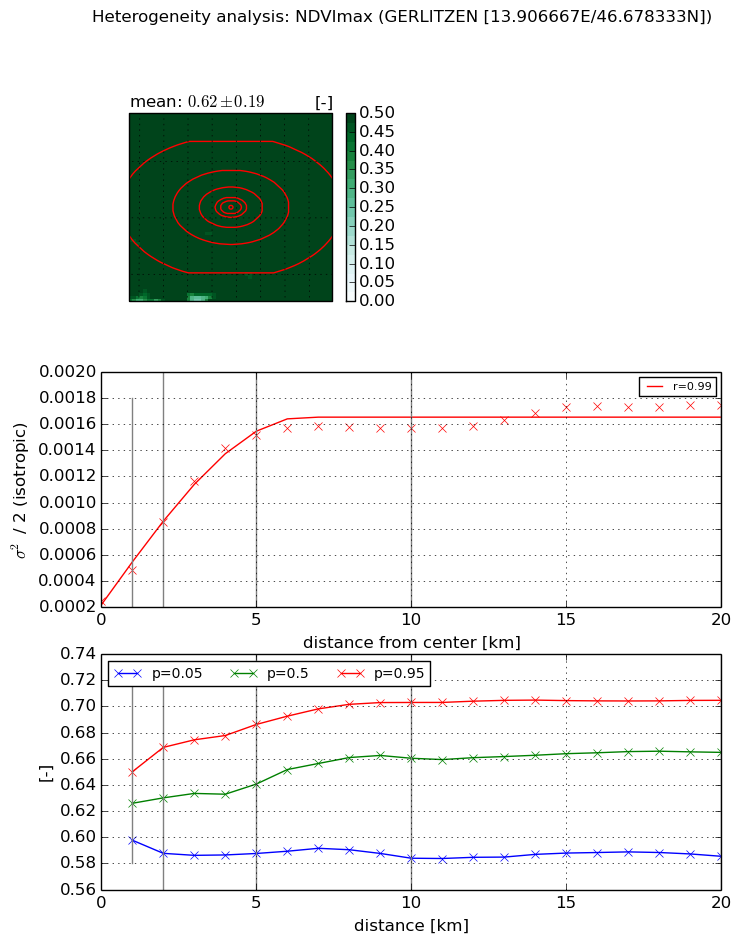
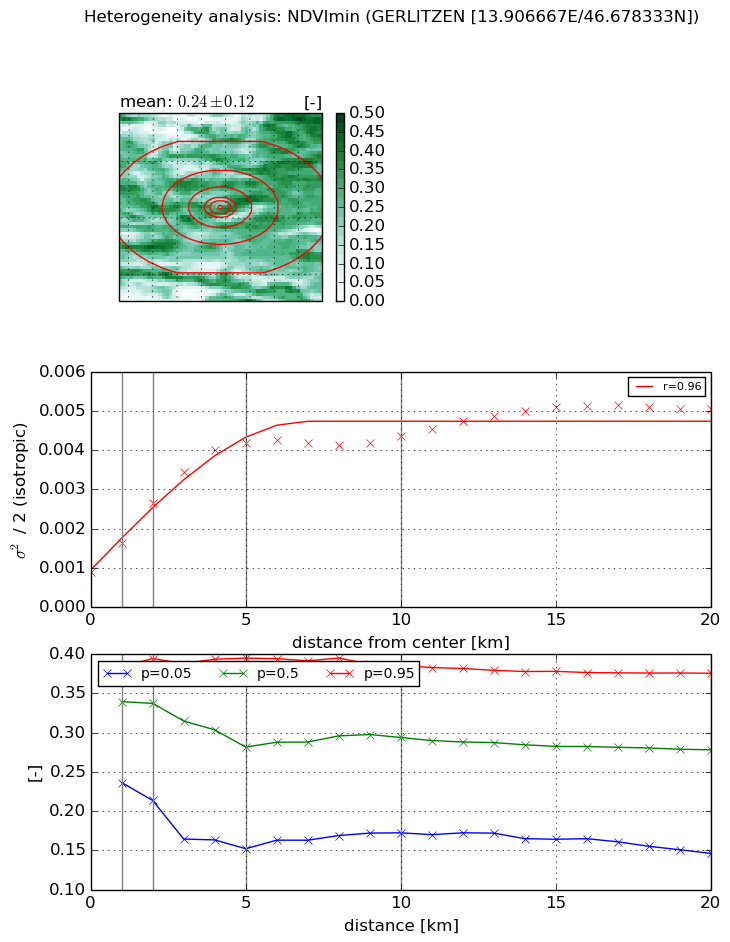
Heterogeneity analysis

The heterogeneity analysis provides information about the spatial and temporal heterogeneity of the site.

Topography


Roman et al. (2009) index


St

10.4974164504

Rcv

-0.0146840359386

Rse

0.0

Rst

-0.0239822759459

Rsv

-0.247118291801


Height range @ 1km [m]

1093

Height range @ 2km [m]

1261

Height range @ 5km [m]

1169

Height range @ 10km [m]

-999

Height range @ 20km [m]

-999


Variance slope @ 1 km

34531

Variance slope @ 2 km

41292

Variance slope @ 5 km

41612

Variance slope @ 10 km

-999

Variance slope @ 20 km

-999


NDVI (max. NDVI composite)


Roman et al. (2009) index


St

11.8773049387

Rcv

0.03010435673

Rse

0.0

Rst

0.0216959811406

Rsv

-0.200782214778


NDVI range @ 1km [-]

0.05

NDVI range @ 2km [-]

0.08

NDVI range @ 5km [-]

0.1

NDVI range @ 10km [-]

0.12

NDVI range @ 20km [-]

0.12


Variance slope @ 1 km

0.000239104982181

Variance slope @ 2 km

0.000303562242036

Variance slope @ 5 km

0.000270504786539

Variance slope @ 10 km

0.000128453990361

Variance slope @ 20 km

5.3039904693e-05


NDVI (min. NDVI composite)I


Roman et al. (2009) index


St

5.31210967641

Rcv

0.105811086213

Rse

0.0

Rst

-0.0689242760963

Rsv

0.390012013544


NDVI range @ 1km [-]

0.15

NDVI range @ 2km [-]

0.18

NDVI range @ 5km [-]

0.24

NDVI range @ 10km [-]

0.21

NDVI range @ 20km [-]

0.23


NDVI slope @ 1 km

0.000745846014476

NDVI slope @ 2 km

0.000877946050964

NDVI slope @ 5 km

0.000695873685019

NDVI slope @ 10 km

0.00030668746199

NDVI slope @ 20 km

0.000158333734692


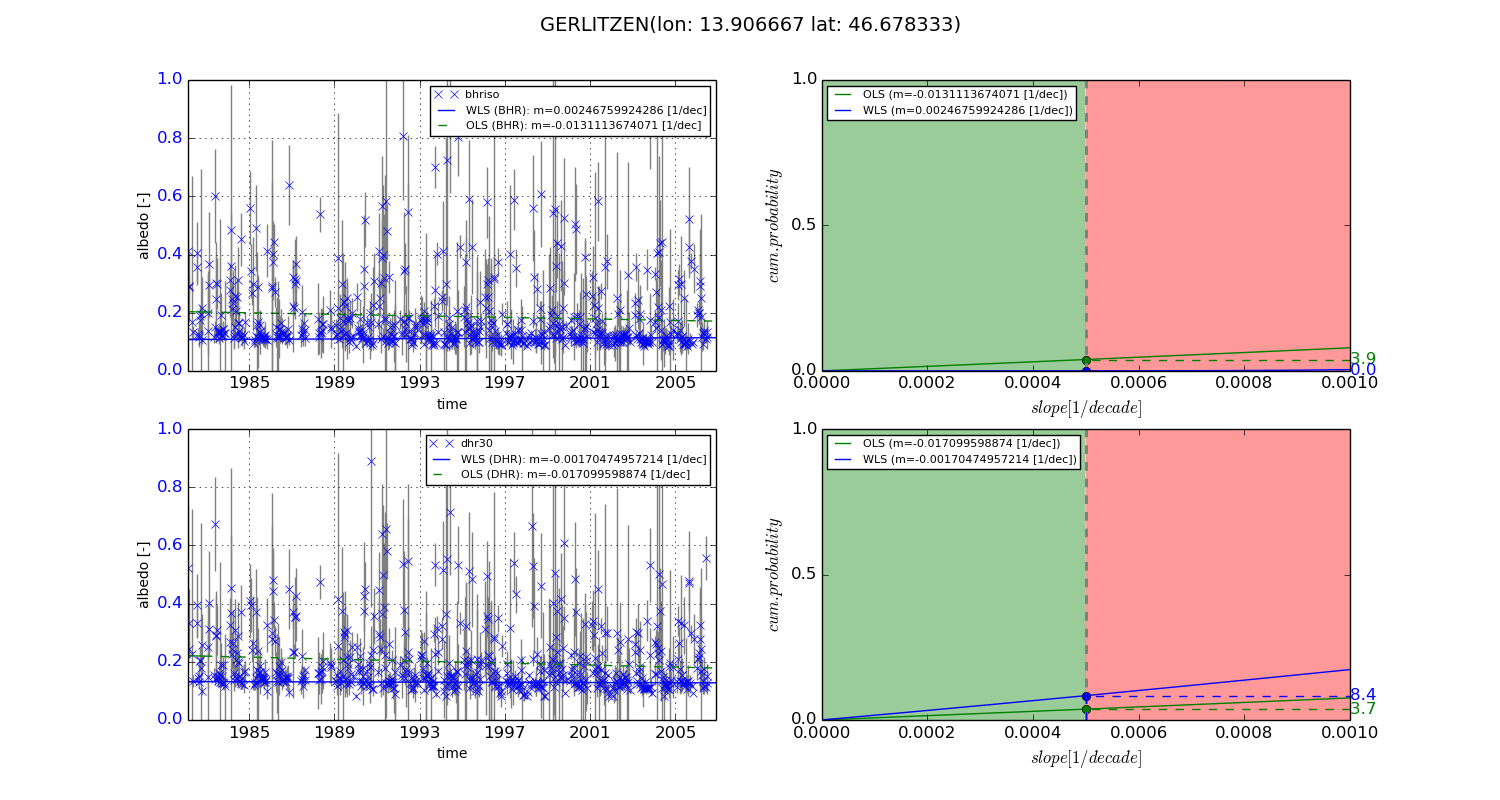
Temporal stability analysis

+000 deg (BHR)


BHR statistics

Temporal stability [1/decade]:


abs

rel


Weighted least square:

0.00246759924286


Ordinary least square:

-0.0131113674071


Probabilities that GCOS criteria is met:

Weighted least square:

0.0 %

Ordinary least square:

3.9 %


DHR statistics

Temporal stability [1/decade]:


abs

rel


Weighted least square:

-0.00170474957214


Ordinary least square:

-0.017099598874


Probabilities that GCOS criteria is met:

Weighted least square:

8.4 %

Ordinary least square:

3.7 %


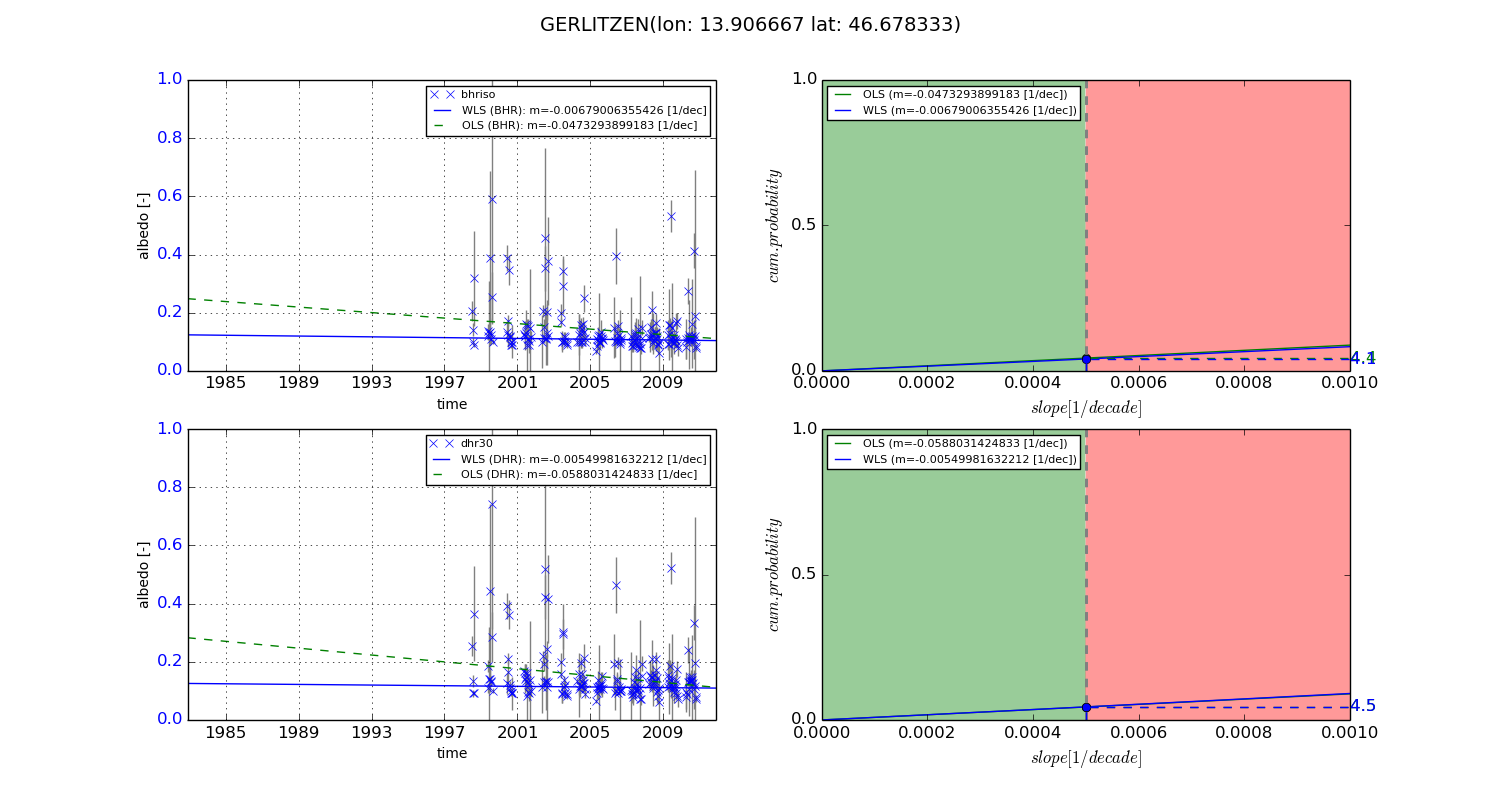
+057/+063 deg (BHR)


BHR statistics

Temporal stability [1/decade]:


abs

rel


Weighted least square:

-0.00679006355426


Ordinary least square:

-0.0473293899183


Probabilities that GCOS criteria is met:

Weighted least square:

4.1 %

Ordinary least square:

4.4 %


DHR statistics

Temporal stability [1/decade]:


abs

rel


Weighted least square:

-0.00549981632212


Ordinary least square:

-0.0588031424833


Probabilities that GCOS criteria is met:

Weighted least square:

4.5 %

Ordinary least square:

4.5 %


Temporal anomaly analyis

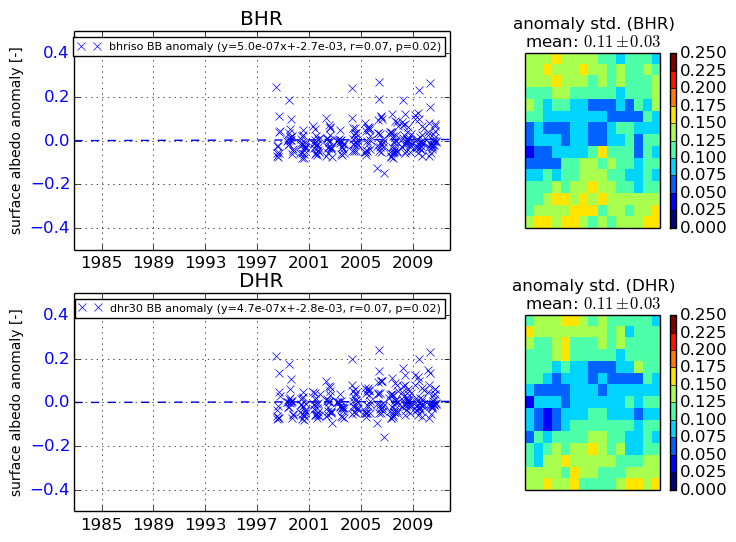
The variance of the temporal anomalies provides an additional measure about the stability of the signal AFTER removal of the mean seasonal cylce.
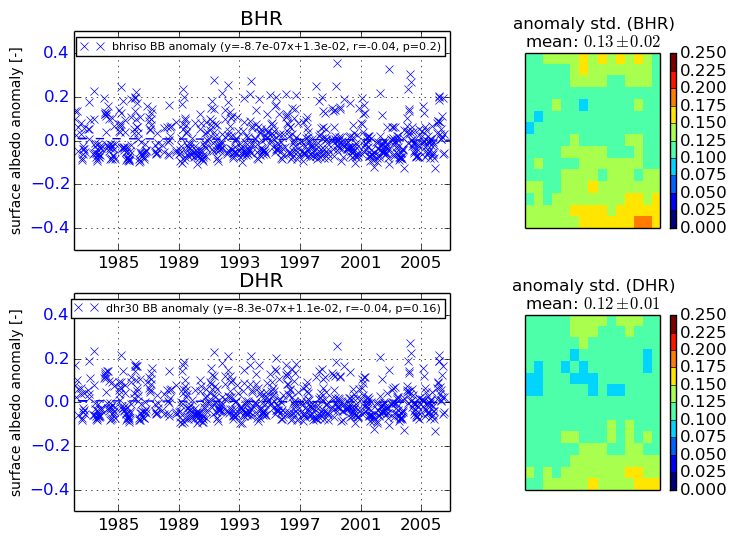
+000 deg


+057/+063 deg