GOODWIN_CREEK


Location

lon / lat [deg]: -89.8729 / 34.2547

Source network: SURFRAD


Geostationary surface albedo (GSA) data


“+000”


“+057/+063”


Landcover information (based on ESA CCI landcover data)


Landcover fractions @ 2km distance


Landcover fractions @ 20 km distance


Legend


Distance to open water bodies [km]:

6.82

Distance to urban areas [km]:

4.27


Radius: 1 km

Number of landcover classes:

5

Dominant landcover type:

130: grassland

Fraction of dominant landcover type [%]:

68.0


Radius: 2 km

Number of landcover classes:

5

Dominant landcover type:

130: grassland

Fraction of dominant landcover type [%]:

78.0


Radius: 5 km

Number of landcover classes:

7

Dominant landcover type:

130: grassland

Fraction of dominant landcover type [%]:

59.0


Radius: 10 km

Number of landcover classes:

10

Dominant landcover type:

130: grassland

Fraction of dominant landcover type [%]:

48.0


Radius: 20 km

Number of landcover classes:

10

Dominant landcover type:

130: grassland

Fraction of dominant landcover type [%]:

29.0


Disturbances


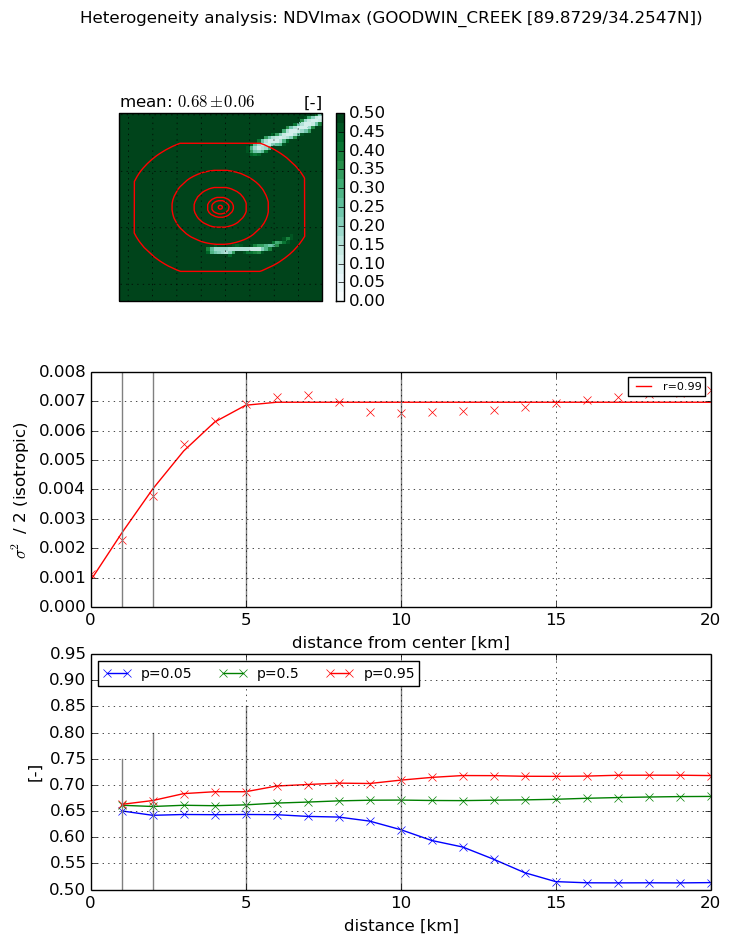
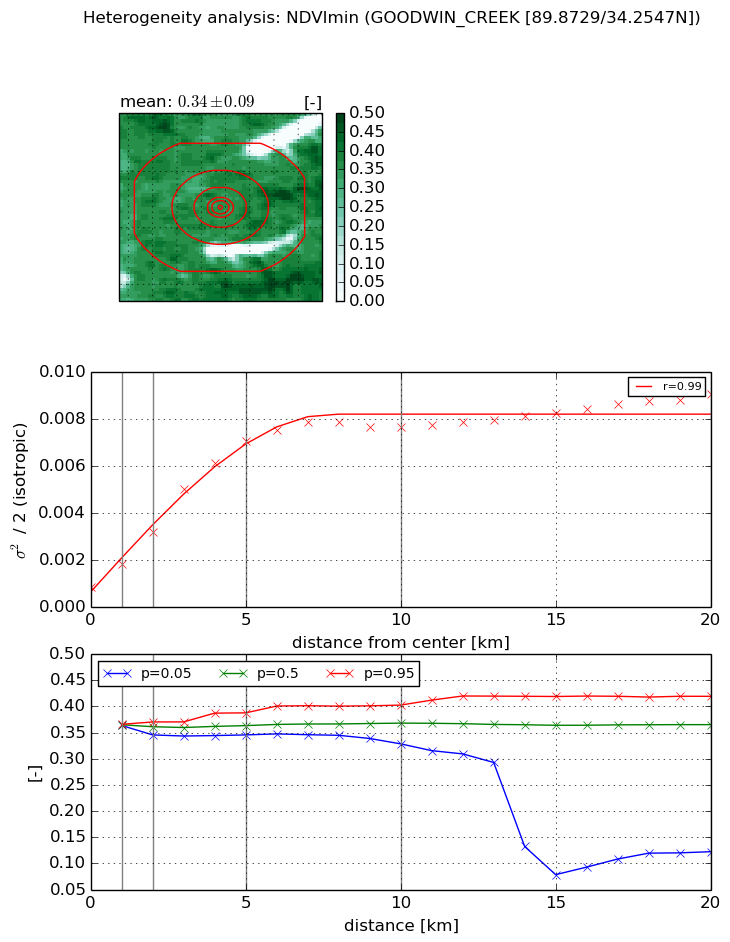
Heterogeneity analysis

The heterogeneity analysis provides information about the spatial and temporal heterogeneity of the site.

Topography


Roman et al. (2009) index


St

1.96787944484e-07

Rcv

0.256406045056

Rse

0.0

Rst

-0.140460193856

Rsv

15244835.9058


Height range @ 1km [m]

24

Height range @ 2km [m]

24

Height range @ 5km [m]

40

Height range @ 10km [m]

-999

Height range @ 20km [m]

-999


Variance slope @ 1 km

61

Variance slope @ 2 km

40

Variance slope @ 5 km

20

Variance slope @ 10 km

-999

Variance slope @ 20 km

-999


NDVI (max. NDVI composite)


Roman et al. (2009) index


St

4.17433519913

Rcv

0.0885642470681

Rse

0.0

Rst

0.259059815775

Rsv

-0.371053249086


NDVI range @ 1km [-]

0.01

NDVI range @ 2km [-]

0.03

NDVI range @ 5km [-]

0.04

NDVI range @ 10km [-]

0.09

NDVI range @ 20km [-]

0.2


Variance slope @ 1 km

0.00113085698952

Variance slope @ 2 km

0.00131944792483

Variance slope @ 5 km

0.00122600866204

Variance slope @ 10 km

0.000531950750868

Variance slope @ 20 km

0.000191177873765


NDVI (min. NDVI composite)I


Roman et al. (2009) index


St

0.458907330835

Rcv

0.519639872446

Rse

0.0

Rst

-0.827942421485

Rsv

5.189685251


NDVI range @ 1km [-]

0.0

NDVI range @ 2km [-]

0.02

NDVI range @ 5km [-]

0.04

NDVI range @ 10km [-]

0.07

NDVI range @ 20km [-]

0.3


NDVI slope @ 1 km

0.000970124817558

NDVI slope @ 2 km

0.00116964687167

NDVI slope @ 5 km

0.00130366031355

NDVI slope @ 10 km

0.000709654582518

NDVI slope @ 20 km

0.000307460368045


Temporal stability analysis

+000 deg (BHR)


BHR statistics

Temporal stability [1/decade]:


abs

rel


Weighted least square:

None


Ordinary least square:

None


Probabilities that GCOS criteria is met:

Weighted least square:

None %

Ordinary least square:

None %


DHR statistics

Temporal stability [1/decade]:


abs

rel


Weighted least square:

None


Ordinary least square:

None


Probabilities that GCOS criteria is met:

Weighted least square:

None %

Ordinary least square:

None %


+057/+063 deg (BHR)


BHR statistics

Temporal stability [1/decade]:


abs

rel


Weighted least square:

None


Ordinary least square:

None


Probabilities that GCOS criteria is met:

Weighted least square:

None %

Ordinary least square:

None %


DHR statistics

Temporal stability [1/decade]:


abs

rel


Weighted least square:

None


Ordinary least square:

None


Probabilities that GCOS criteria is met:

Weighted least square:

None %

Ordinary least square:

None %


Temporal anomaly analyis

The variance of the temporal anomalies provides an additional measure about the stability of the signal AFTER removal of the mean seasonal cylce.

+000 deg


+057/+063 deg