GRANADA


Location

lon / lat [deg]: -3.605 / 37.164

Source network: AERONET


Geostationary surface albedo (GSA) data


“+000”


“+057/+063”


Landcover information (based on ESA CCI landcover data)


Landcover fractions @ 2km distance


Landcover fractions @ 20 km distance


Legend


Distance to open water bodies [km]:

11.19

Distance to urban areas [km]:

0.16


Radius: 1 km

Number of landcover classes:

4

Dominant landcover type:

190: urban areas

Fraction of dominant landcover type [%]:

85.0


Radius: 2 km

Number of landcover classes:

5

Dominant landcover type:

190: urban areas

Fraction of dominant landcover type [%]:

81.0


Radius: 5 km

Number of landcover classes:

6

Dominant landcover type:

190: urban areas

Fraction of dominant landcover type [%]:

69.0


Radius: 10 km

Number of landcover classes:

9

Dominant landcover type:

190: urban areas

Fraction of dominant landcover type [%]:

37.0


Radius: 20 km

Number of landcover classes:

9

Dominant landcover type:

10: cropland, rainfed

Fraction of dominant landcover type [%]:

21.0


Disturbances


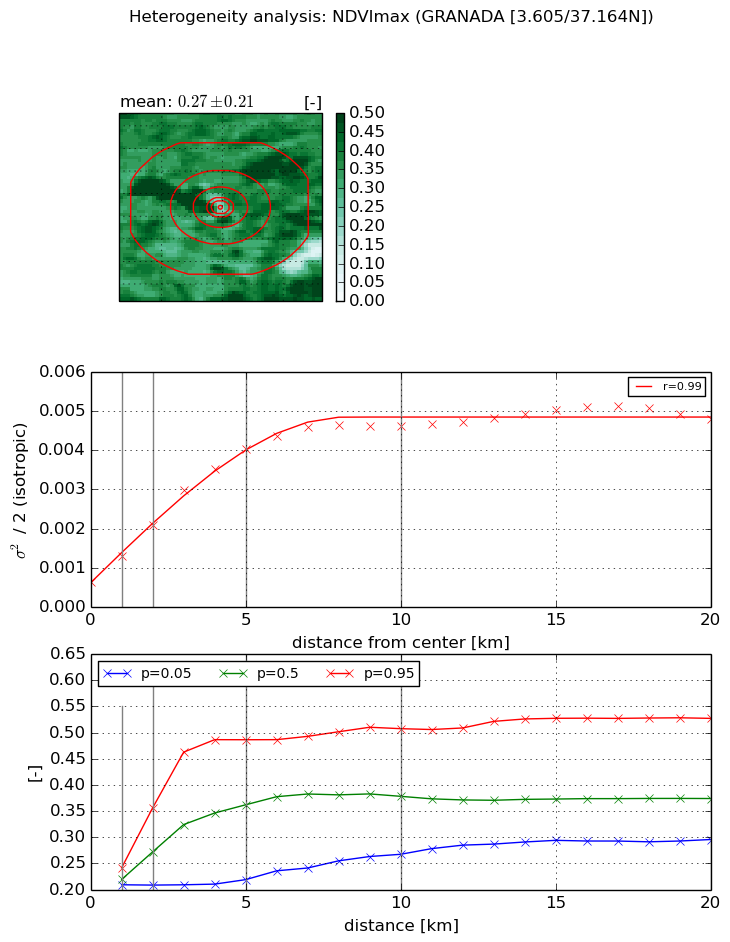
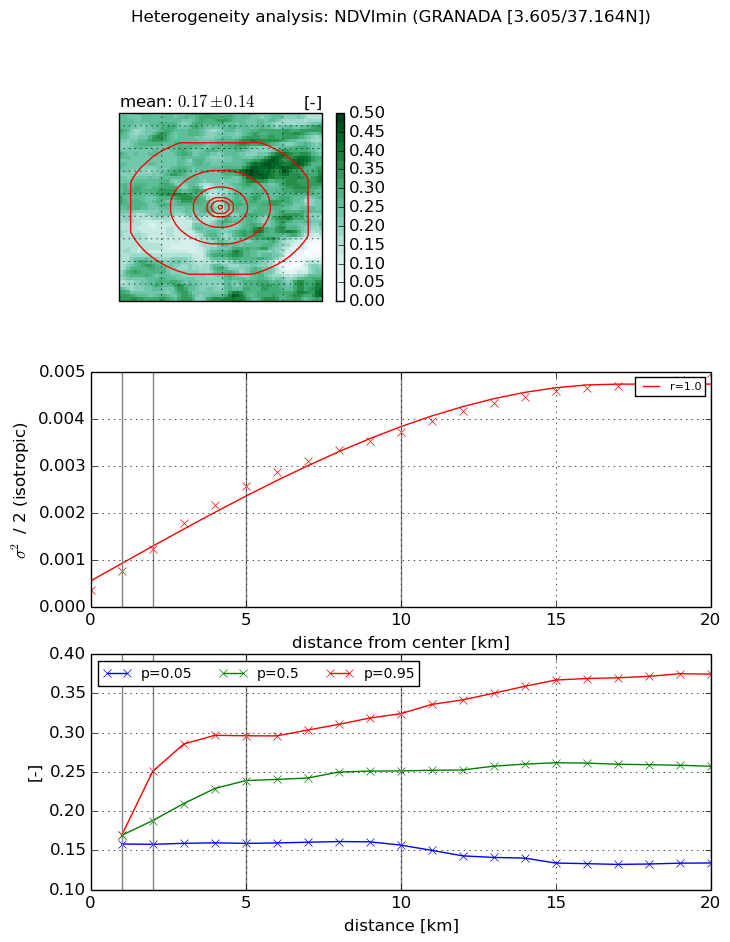
Heterogeneity analysis

The heterogeneity analysis provides information about the spatial and temporal heterogeneity of the site.

Topography


Roman et al. (2009) index


St

1.92752539876

Rcv

0.556399223987

Rse

0.0

Rst

-5.00720566088e-07

Rsv

-1.0


Height range @ 1km [m]

36

Height range @ 2km [m]

75

Height range @ 5km [m]

276

Height range @ 10km [m]

-999

Height range @ 20km [m]

-999


Variance slope @ 1 km

1337

Variance slope @ 2 km

1185

Variance slope @ 5 km

1411

Variance slope @ 10 km

-999

Variance slope @ 20 km

-999


NDVI (max. NDVI composite)


Roman et al. (2009) index


St

5.07869749297

Rcv

-0.087333673587

Rse

0.0

Rst

-0.253240912497

Rsv

0.250128050596


NDVI range @ 1km [-]

0.03

NDVI range @ 2km [-]

0.15

NDVI range @ 5km [-]

0.27

NDVI range @ 10km [-]

0.24

NDVI range @ 20km [-]

0.23


Variance slope @ 1 km

0.000668767625535

Variance slope @ 2 km

0.000728667012123

Variance slope @ 5 km

0.000700221353484

Variance slope @ 10 km

0.000408225310786

Variance slope @ 20 km

0.000169471301027


NDVI (min. NDVI composite)I


Roman et al. (2009) index


St

4.83143331565

Rcv

0.0469286497331

Rse

0.0

Rst

-0.137900536922

Rsv

0.436104561987


NDVI range @ 1km [-]

0.01

NDVI range @ 2km [-]

0.09

NDVI range @ 5km [-]

0.14

NDVI range @ 10km [-]

0.17

NDVI range @ 20km [-]

0.24


NDVI slope @ 1 km

0.000397473007992

NDVI slope @ 2 km

0.000432582569322

NDVI slope @ 5 km

0.00045151662239

NDVI slope @ 10 km

0.000341374908911

NDVI slope @ 20 km

0.000218277320245


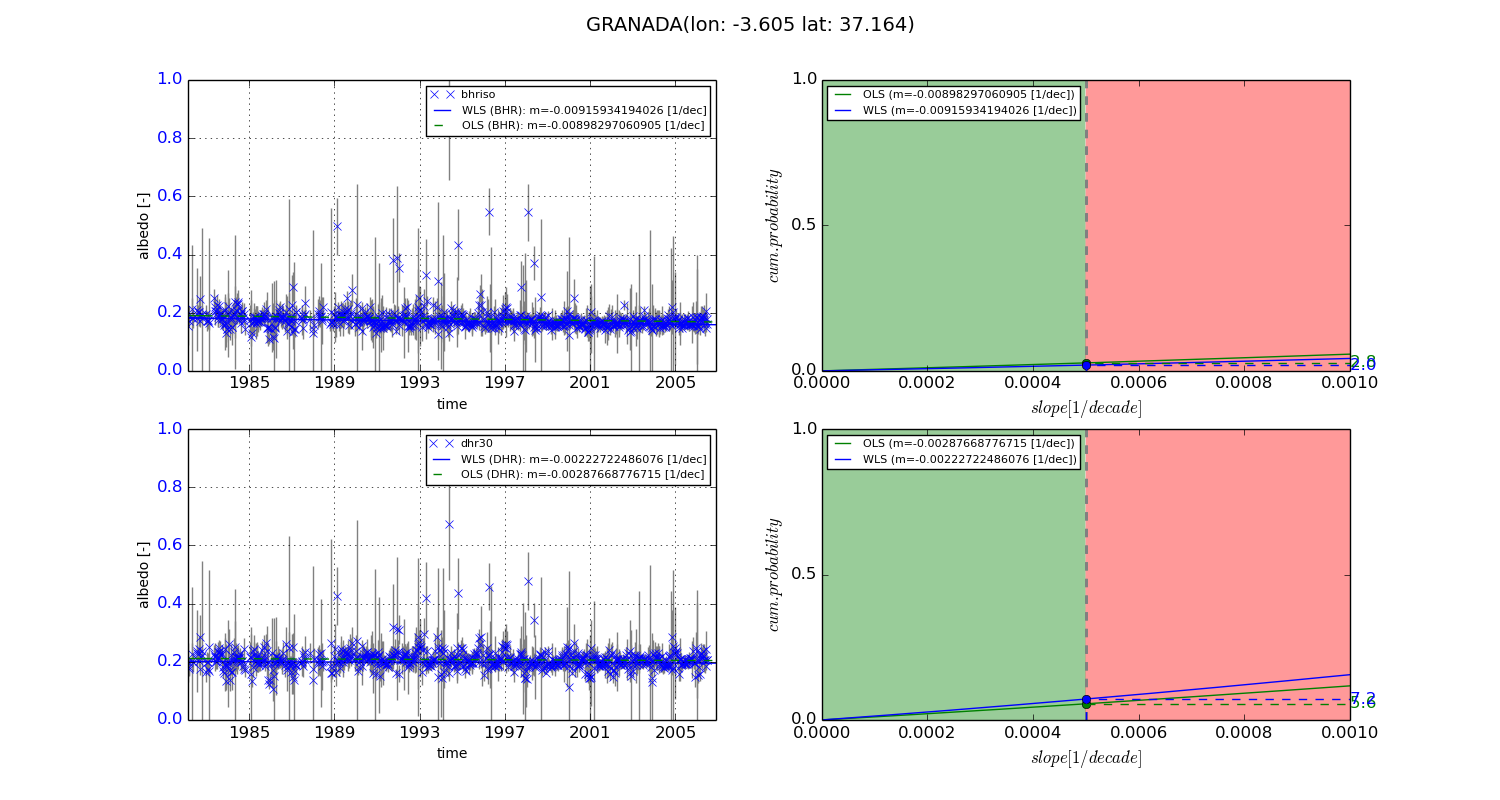
Temporal stability analysis

+000 deg (BHR)


BHR statistics

Temporal stability [1/decade]:


abs

rel


Weighted least square:

-0.00915934194026


Ordinary least square:

-0.00898297060905


Probabilities that GCOS criteria is met:

Weighted least square:

2.0 %

Ordinary least square:

2.8 %


DHR statistics

Temporal stability [1/decade]:


abs

rel


Weighted least square:

-0.00222722486076


Ordinary least square:

-0.00287668776715


Probabilities that GCOS criteria is met:

Weighted least square:

7.2 %

Ordinary least square:

5.6 %


+057/+063 deg (BHR)


BHR statistics

Temporal stability [1/decade]:


abs

rel


Weighted least square:

-99999.0


Ordinary least square:

-99999.0


Probabilities that GCOS criteria is met:

Weighted least square:

-99999.0 %

Ordinary least square:

-99999.0 %


DHR statistics

Temporal stability [1/decade]:


abs

rel


Weighted least square:

-99999.0


Ordinary least square:

-99999.0


Probabilities that GCOS criteria is met:

Weighted least square:

-99999.0 %

Ordinary least square:

-99999.0 %


Temporal anomaly analyis

The variance of the temporal anomalies provides an additional measure about the stability of the signal AFTER removal of the mean seasonal cylce.
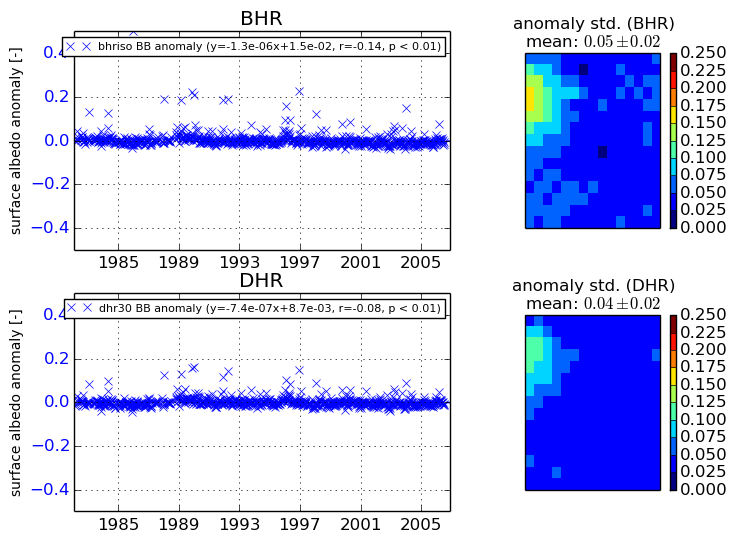
+000 deg


+057/+063 deg