GREAT_FALLS


Location

lon / lat [deg]: -77.245 / 39.0053

Source network: AERONET


Geostationary surface albedo (GSA) data


“+000”


“+057/+063”


Landcover information (based on ESA CCI landcover data)


Landcover fractions @ 2km distance


Landcover fractions @ 20 km distance


Legend


Distance to open water bodies [km]:

0.34

Distance to urban areas [km]:

0.25


Radius: 1 km

Number of landcover classes:

5

Dominant landcover type:

61: Tree cover, broadleaved, decidous (closed > 40%)

Fraction of dominant landcover type [%]:

36.0


Radius: 2 km

Number of landcover classes:

8

Dominant landcover type:

61: Tree cover, broadleaved, decidous (closed > 40%)

Fraction of dominant landcover type [%]:

51.0


Radius: 5 km

Number of landcover classes:

6

Dominant landcover type:

61: Tree cover, broadleaved, decidous (closed > 40%)

Fraction of dominant landcover type [%]:

29.0


Radius: 10 km

Number of landcover classes:

6

Dominant landcover type:

190: urban areas

Fraction of dominant landcover type [%]:

45.0


Radius: 20 km

Number of landcover classes:

5

Dominant landcover type:

190: urban areas

Fraction of dominant landcover type [%]:

68.0


Disturbances


Heterogeneity analysis

The heterogeneity analysis provides information about the spatial and temporal heterogeneity of the site.

Topography


Roman et al. (2009) index


St

2.3034511486

Rcv

-0.0573624877266

Rse

0.0

Rst

-0.153827316831

Rsv

1.09120378075


Height range @ 1km [m]

69

Height range @ 2km [m]

77

Height range @ 5km [m]

74

Height range @ 10km [m]

-999

Height range @ 20km [m]

-999


Variance slope @ 1 km

253

Variance slope @ 2 km

207

Variance slope @ 5 km

102

Variance slope @ 10 km

-999

Variance slope @ 20 km

-999


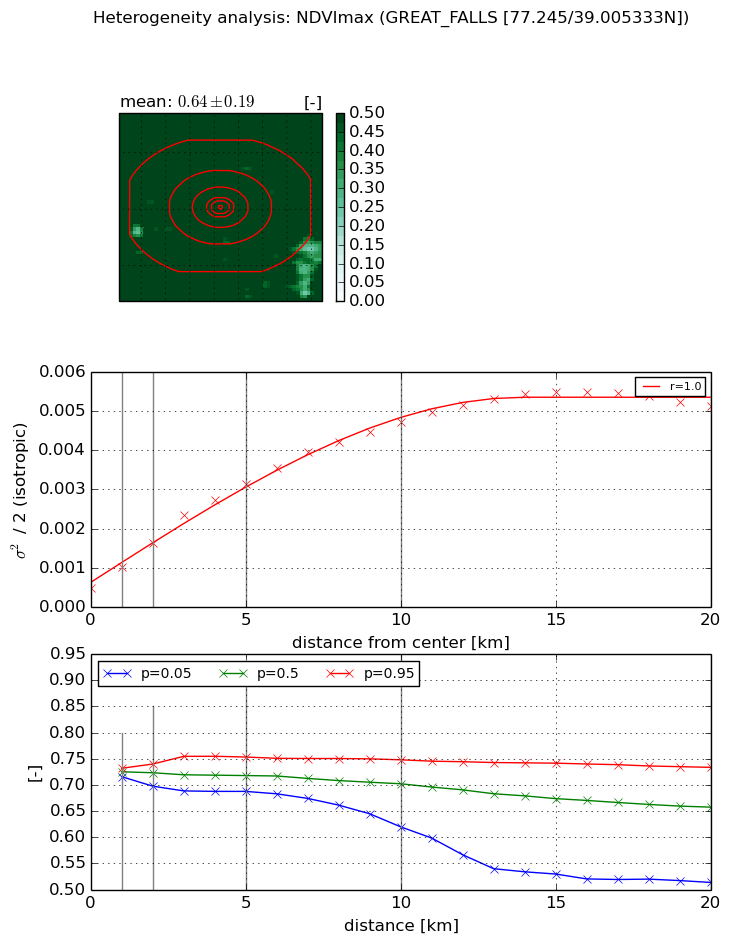
NDVI (max. NDVI composite)


Roman et al. (2009) index


St

10.2401861584

Rcv

0.019280655247

Rse

0.0

Rst

-0.213307381211

Rsv

-0.0603753876032


NDVI range @ 1km [-]

0.02

NDVI range @ 2km [-]

0.04

NDVI range @ 5km [-]

0.07

NDVI range @ 10km [-]

0.13

NDVI range @ 20km [-]

0.22


Variance slope @ 1 km

0.000543237297787

Variance slope @ 2 km

0.000576693429074

Variance slope @ 5 km

0.000548710834778

Variance slope @ 10 km

0.000424505169326

Variance slope @ 20 km

0.000231750011181


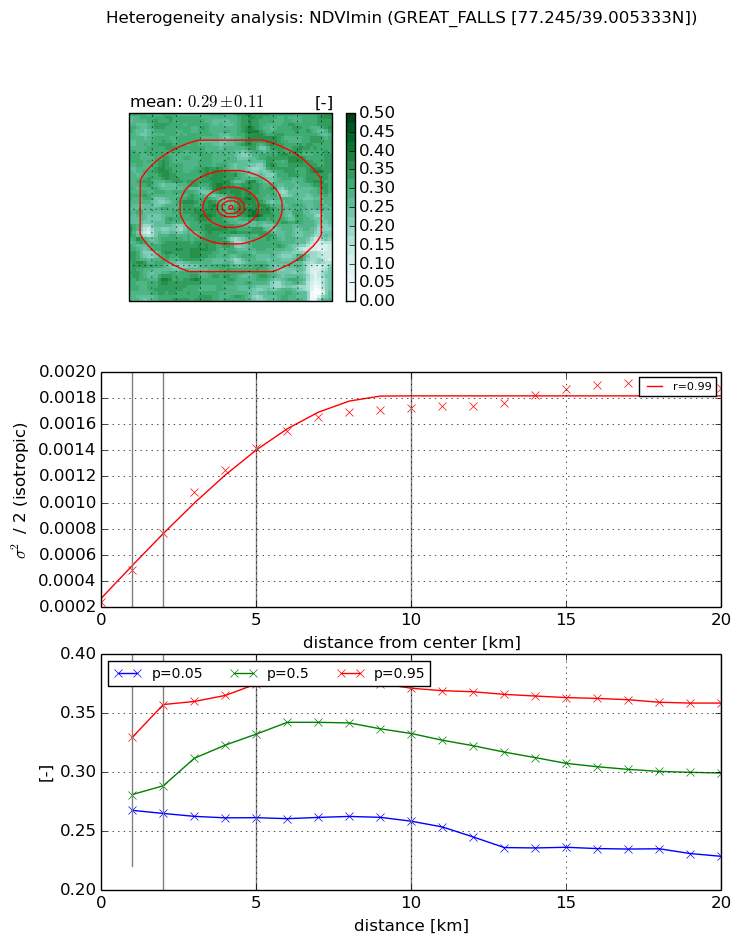
NDVI (min. NDVI composite)I


Roman et al. (2009) index


St

20.5953170283

Rcv

0.0758680619324

Rse

0.0

Rst

-0.020426213307

Rsv

0.049369906374


NDVI range @ 1km [-]

0.06

NDVI range @ 2km [-]

0.09

NDVI range @ 5km [-]

0.11

NDVI range @ 10km [-]

0.11

NDVI range @ 20km [-]

0.13


NDVI slope @ 1 km

0.000251651354045

NDVI slope @ 2 km

0.000265548146726

NDVI slope @ 5 km

0.000242415795666

NDVI slope @ 10 km

0.000150444631849

NDVI slope @ 20 km

6.71325349195e-05


Temporal stability analysis

+000 deg (BHR)


BHR statistics

Temporal stability [1/decade]:


abs

rel


Weighted least square:

-99999.0


Ordinary least square:

-99999.0


Probabilities that GCOS criteria is met:

Weighted least square:

-99999.0 %

Ordinary least square:

-99999.0 %


DHR statistics

Temporal stability [1/decade]:


abs

rel


Weighted least square:

-99999.0


Ordinary least square:

-99999.0


Probabilities that GCOS criteria is met:

Weighted least square:

-99999.0 %

Ordinary least square:

-99999.0 %


+057/+063 deg (BHR)


BHR statistics

Temporal stability [1/decade]:


abs

rel


Weighted least square:

None


Ordinary least square:

None


Probabilities that GCOS criteria is met:

Weighted least square:

None %

Ordinary least square:

None %


DHR statistics

Temporal stability [1/decade]:


abs

rel


Weighted least square:

None


Ordinary least square:

None


Probabilities that GCOS criteria is met:

Weighted least square:

None %

Ordinary least square:

None %


Temporal anomaly analyis

The variance of the temporal anomalies provides an additional measure about the stability of the signal AFTER removal of the mean seasonal cylce.

+000 deg


+057/+063 deg