HAGERSTOWN


Location

lon / lat [deg]: -77.725 / 39.7083

Source network: AERONET


Geostationary surface albedo (GSA) data


“+000”


“+057/+063”


Landcover information (based on ESA CCI landcover data)


Landcover fractions @ 2km distance


Landcover fractions @ 20 km distance


Legend


Distance to open water bodies [km]:

7.46

Distance to urban areas [km]:

0.19


Radius: 1 km

Number of landcover classes:

2

Dominant landcover type:

190: urban areas

Fraction of dominant landcover type [%]:

84.0


Radius: 2 km

Number of landcover classes:

4

Dominant landcover type:

130: grassland

Fraction of dominant landcover type [%]:

43.0


Radius: 5 km

Number of landcover classes:

5

Dominant landcover type:

130: grassland

Fraction of dominant landcover type [%]:

58.0


Radius: 10 km

Number of landcover classes:

4

Dominant landcover type:

130: grassland

Fraction of dominant landcover type [%]:

64.0


Radius: 20 km

Number of landcover classes:

5

Dominant landcover type:

130: grassland

Fraction of dominant landcover type [%]:

66.0


Disturbances


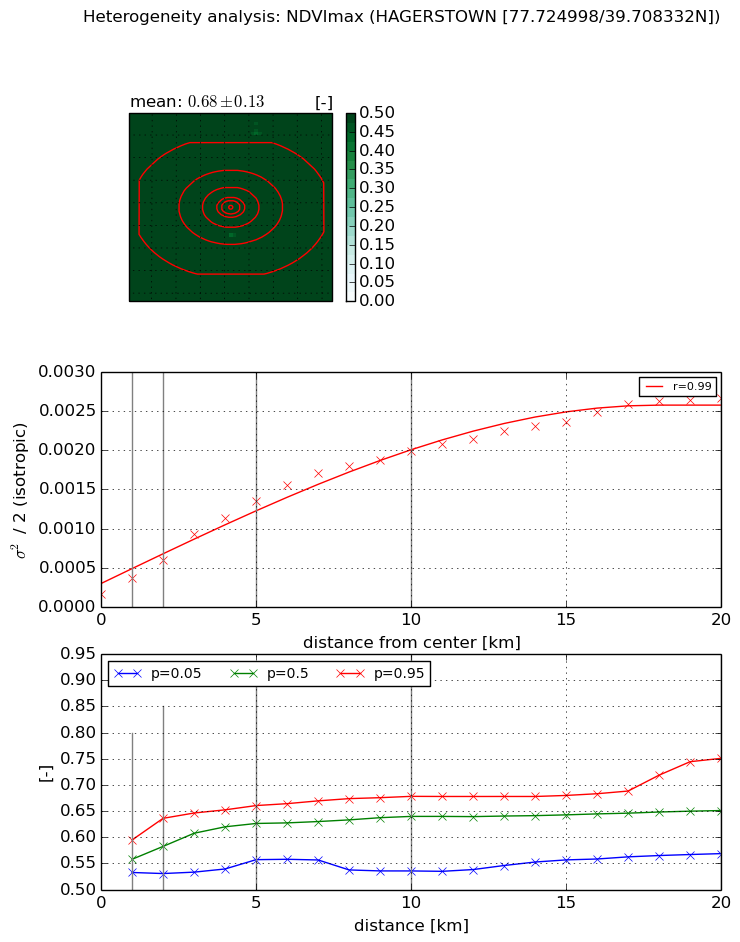
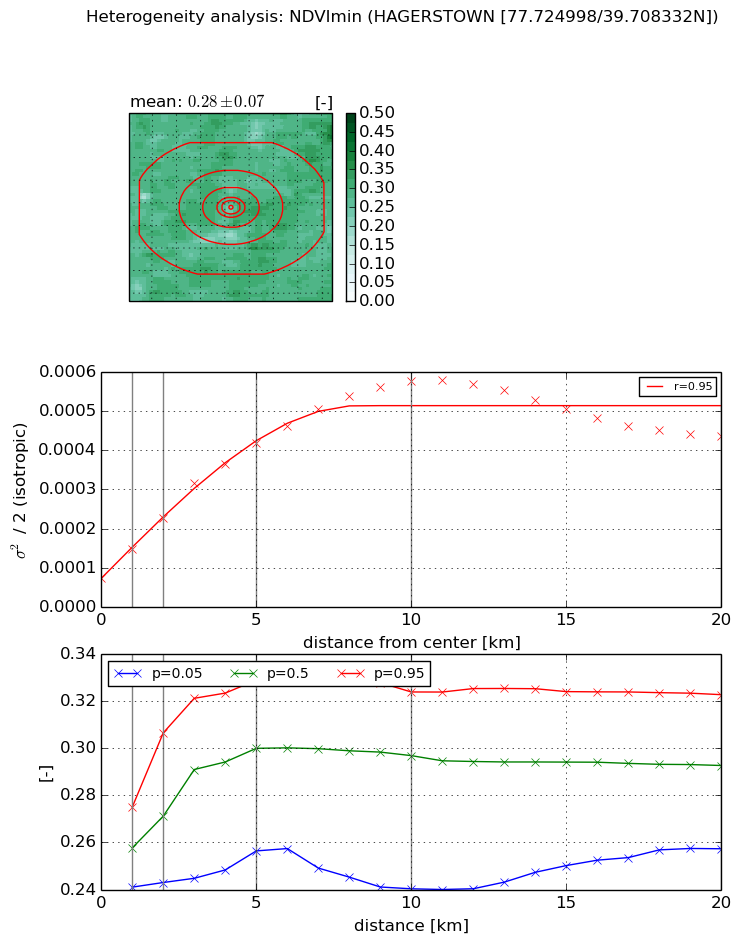
Heterogeneity analysis

The heterogeneity analysis provides information about the spatial and temporal heterogeneity of the site.

Topography


Roman et al. (2009) index


St

2.05383963002

Rcv

0.42976003803

Rse

0.0

Rst

-0.0109633414103

Rsv

1.01995541755


Height range @ 1km [m]

21

Height range @ 2km [m]

35

Height range @ 5km [m]

59

Height range @ 10km [m]

-999

Height range @ 20km [m]

-999


Variance slope @ 1 km

55

Variance slope @ 2 km

68

Variance slope @ 5 km

89

Variance slope @ 10 km

-999

Variance slope @ 20 km

-999


NDVI (max. NDVI composite)


Roman et al. (2009) index


St

5.38933975382

Rcv

-0.0975756048591

Rse

0.0

Rst

-0.135526324375

Rsv

0.323552528833


NDVI range @ 1km [-]

0.06

NDVI range @ 2km [-]

0.11

NDVI range @ 5km [-]

0.1

NDVI range @ 10km [-]

0.14

NDVI range @ 20km [-]

0.18


Variance slope @ 1 km

0.000206072523517

Variance slope @ 2 km

0.00021705286761

Variance slope @ 5 km

0.000244228063182

Variance slope @ 10 km

0.00018805103947

Variance slope @ 20 km

0.000119191446611


NDVI (min. NDVI composite)I


Roman et al. (2009) index


St

9.90245139296

Rcv

-0.111453715825

Rse

0.0

Rst

-0.0480988767875

Rsv

0.143402694008


NDVI range @ 1km [-]

0.03

NDVI range @ 2km [-]

0.06

NDVI range @ 5km [-]

0.07

NDVI range @ 10km [-]

0.08

NDVI range @ 20km [-]

0.07


NDVI slope @ 1 km

7.41470643947e-05

NDVI slope @ 2 km

7.69256818217e-05

NDVI slope @ 5 km

7.00221108833e-05

NDVI slope @ 10 km

5.06010833274e-05

NDVI slope @ 20 km

1.38485594599e-05


Temporal stability analysis

+000 deg (BHR)


BHR statistics

Temporal stability [1/decade]:


abs

rel


Weighted least square:

-99999.0


Ordinary least square:

-99999.0


Probabilities that GCOS criteria is met:

Weighted least square:

-99999.0 %

Ordinary least square:

-99999.0 %


DHR statistics

Temporal stability [1/decade]:


abs

rel


Weighted least square:

-99999.0


Ordinary least square:

-99999.0


Probabilities that GCOS criteria is met:

Weighted least square:

-99999.0 %

Ordinary least square:

-99999.0 %


+057/+063 deg (BHR)


BHR statistics

Temporal stability [1/decade]:


abs

rel


Weighted least square:

None


Ordinary least square:

None


Probabilities that GCOS criteria is met:

Weighted least square:

None %

Ordinary least square:

None %


DHR statistics

Temporal stability [1/decade]:


abs

rel


Weighted least square:

None


Ordinary least square:

None


Probabilities that GCOS criteria is met:

Weighted least square:

None %

Ordinary least square:

None %


Temporal anomaly analyis

The variance of the temporal anomalies provides an additional measure about the stability of the signal AFTER removal of the mean seasonal cylce.

+000 deg


+057/+063 deg