HAMI


Location

lon / lat [deg]: 93.5167 / 42.8167

Source network: AERONET


Geostationary surface albedo (GSA) data


“+000”


“+057/+063”


Landcover information (based on ESA CCI landcover data)


Landcover fractions @ 2km distance


Landcover fractions @ 20 km distance


Legend


Distance to open water bodies [km]:

19.56

Distance to urban areas [km]:

0.19


Radius: 1 km

Number of landcover classes:

2

Dominant landcover type:

190: urban areas

Fraction of dominant landcover type [%]:

82.0


Radius: 2 km

Number of landcover classes:

2

Dominant landcover type:

190: urban areas

Fraction of dominant landcover type [%]:

66.0


Radius: 5 km

Number of landcover classes:

4

Dominant landcover type:

20: cropland, irrigated or post-flooded

Fraction of dominant landcover type [%]:

50.0


Radius: 10 km

Number of landcover classes:

4

Dominant landcover type:

20: cropland, irrigated or post-flooded

Fraction of dominant landcover type [%]:

59.0


Radius: 20 km

Number of landcover classes:

4

Dominant landcover type:

200: bare areas

Fraction of dominant landcover type [%]:

59.0


Disturbances


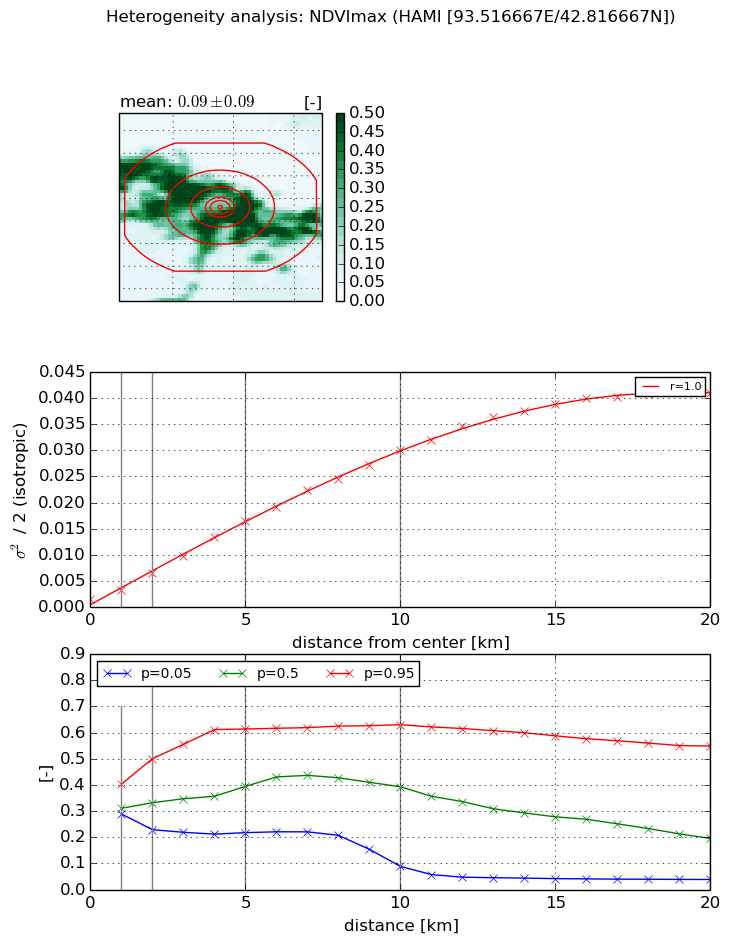
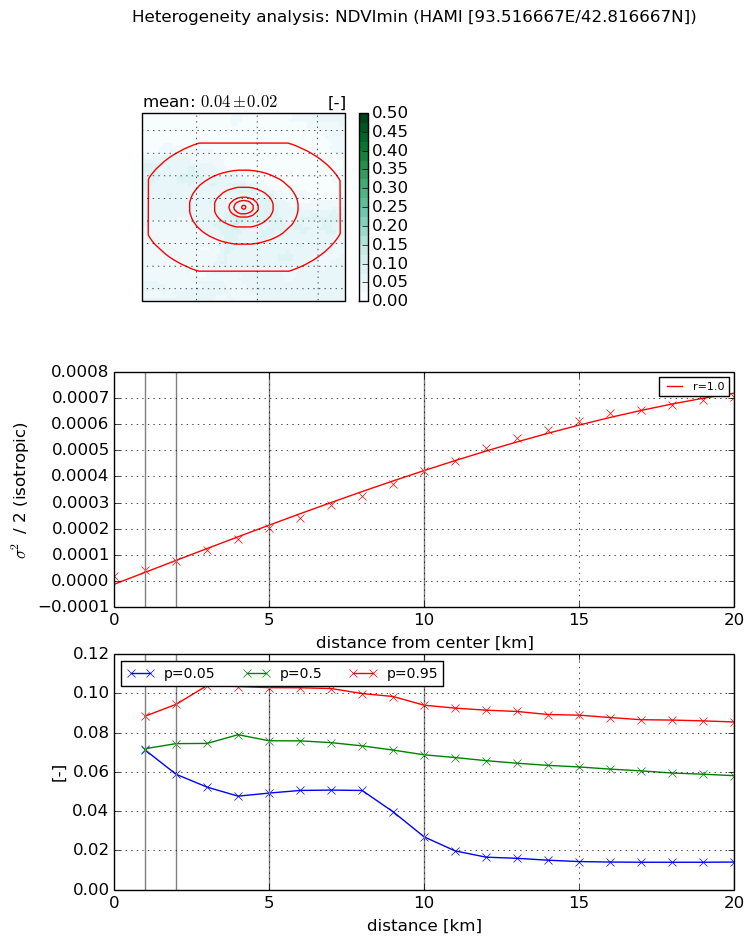
Heterogeneity analysis

The heterogeneity analysis provides information about the spatial and temporal heterogeneity of the site.

Topography


Roman et al. (2009) index


St

2.0183980329

Rcv

0.486324223639

Rse

0.0

Rst

-3.02752791175e-06

Rsv

-0.999999999999


Height range @ 1km [m]

16

Height range @ 2km [m]

30

Height range @ 5km [m]

64

Height range @ 10km [m]

-999

Height range @ 20km [m]

-999


Variance slope @ 1 km

17

Variance slope @ 2 km

31

Variance slope @ 5 km

78

Variance slope @ 10 km

-999

Variance slope @ 20 km

-999


NDVI (max. NDVI composite)


Roman et al. (2009) index


St

2.34418697532

Rcv

-0.0448031744247

Rse

0.0

Rst

0.135445285367

Rsv

1.09951293791


NDVI range @ 1km [-]

0.11

NDVI range @ 2km [-]

0.27

NDVI range @ 5km [-]

0.4

NDVI range @ 10km [-]

0.54

NDVI range @ 20km [-]

0.51


Variance slope @ 1 km

0.00187852630991

Variance slope @ 2 km

0.00248427208474

Variance slope @ 5 km

0.00309754542798

Variance slope @ 10 km

0.00294047826104

Variance slope @ 20 km

0.00212050513777


NDVI (min. NDVI composite)I


Roman et al. (2009) index


St

12.7873223453

Rcv

-0.00188228785369

Rse

0.0

Rst

0.0554416882774

Rsv

0.177283388804


NDVI range @ 1km [-]

0.02

NDVI range @ 2km [-]

0.04

NDVI range @ 5km [-]

0.05

NDVI range @ 10km [-]

0.07

NDVI range @ 20km [-]

0.07


NDVI slope @ 1 km

2.29790634088e-05

NDVI slope @ 2 km

3.01669777633e-05

NDVI slope @ 5 km

3.79461494016e-05

NDVI slope @ 10 km

4.0847389721e-05

NDVI slope @ 20 km

3.73461874497e-05


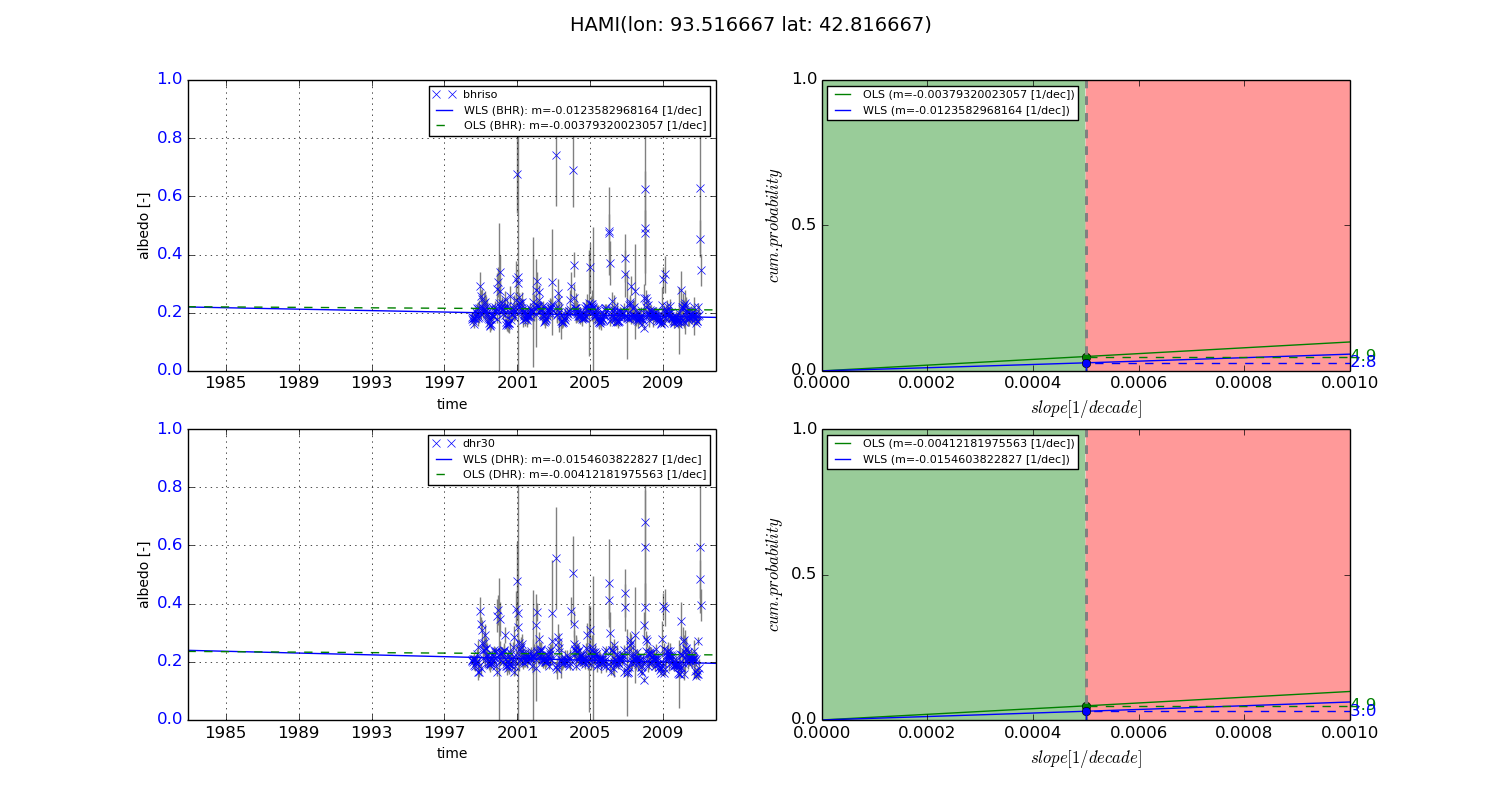
Temporal stability analysis

+000 deg (BHR)


BHR statistics

Temporal stability [1/decade]:


abs

rel


Weighted least square:

None


Ordinary least square:

None


Probabilities that GCOS criteria is met:

Weighted least square:

None %

Ordinary least square:

None %


DHR statistics

Temporal stability [1/decade]:


abs

rel


Weighted least square:

None


Ordinary least square:

None


Probabilities that GCOS criteria is met:

Weighted least square:

None %

Ordinary least square:

None %


+057/+063 deg (BHR)


BHR statistics

Temporal stability [1/decade]:


abs

rel


Weighted least square:

-0.0123582968164


Ordinary least square:

-0.00379320023057


Probabilities that GCOS criteria is met:

Weighted least square:

2.8 %

Ordinary least square:

4.9 %


DHR statistics

Temporal stability [1/decade]:


abs

rel


Weighted least square:

-0.0154603822827


Ordinary least square:

-0.00412181975563


Probabilities that GCOS criteria is met:

Weighted least square:

3.0 %

Ordinary least square:

4.9 %


Temporal anomaly analyis

The variance of the temporal anomalies provides an additional measure about the stability of the signal AFTER removal of the mean seasonal cylce.

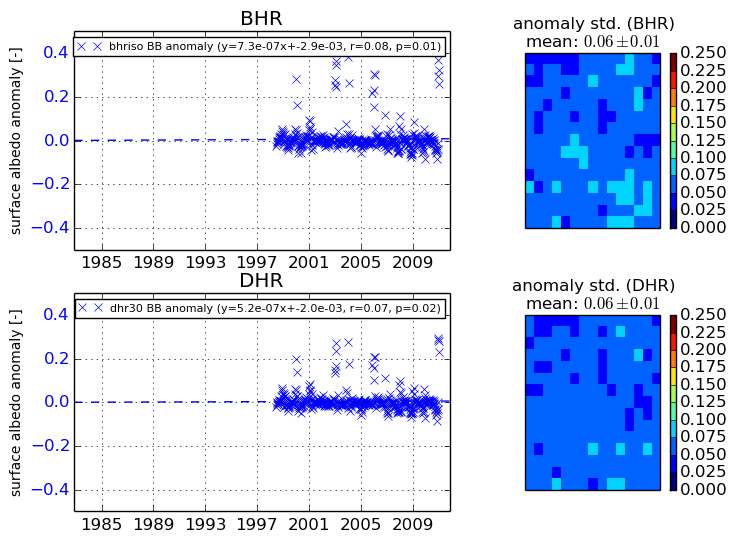
+000 deg


+057/+063 deg