HAND_E_60708


Location

lon / lat [deg]: 80.551 / 26.455

Source network: AERONET


Geostationary surface albedo (GSA) data


“+000”


“+057/+063”


Landcover information (based on ESA CCI landcover data)


Landcover fractions @ 2km distance


Landcover fractions @ 20 km distance


Legend


Distance to open water bodies [km]:

3.2

Distance to urban areas [km]:

1.02


Radius: 1 km

Number of landcover classes:

1

Dominant landcover type:

20: cropland, irrigated or post-flooded

Fraction of dominant landcover type [%]:

100.0


Radius: 2 km

Number of landcover classes:

3

Dominant landcover type:

20: cropland, irrigated or post-flooded

Fraction of dominant landcover type [%]:

85.0


Radius: 5 km

Number of landcover classes:

3

Dominant landcover type:

20: cropland, irrigated or post-flooded

Fraction of dominant landcover type [%]:

92.0


Radius: 10 km

Number of landcover classes:

3

Dominant landcover type:

20: cropland, irrigated or post-flooded

Fraction of dominant landcover type [%]:

79.0


Radius: 20 km

Number of landcover classes:

3

Dominant landcover type:

20: cropland, irrigated or post-flooded

Fraction of dominant landcover type [%]:

79.0


Disturbances


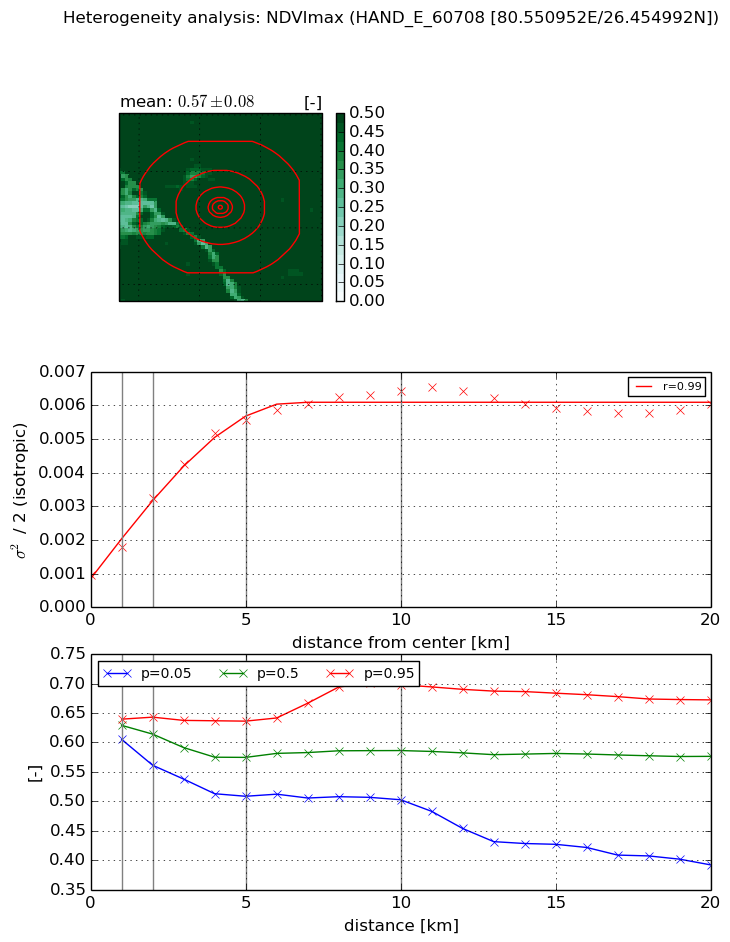
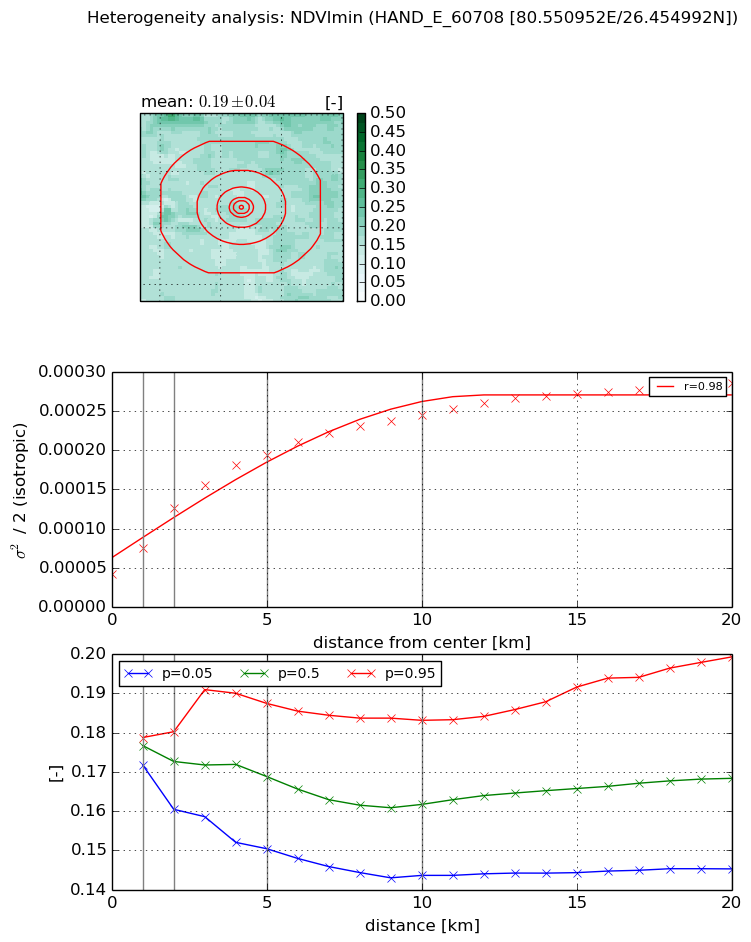
Heterogeneity analysis

The heterogeneity analysis provides information about the spatial and temporal heterogeneity of the site.

Topography


Roman et al. (2009) index


St

0.63946218278

Rcv

0.450453107673

Rse

0.0

Rst

-0.0901502515628

Rsv

4.15083904469


Height range @ 1km [m]

6

Height range @ 2km [m]

7

Height range @ 5km [m]

10

Height range @ 10km [m]

-999

Height range @ 20km [m]

-999


Variance slope @ 1 km

3

Variance slope @ 2 km

3

Variance slope @ 5 km

3

Variance slope @ 10 km

-999

Variance slope @ 20 km

-999


NDVI (max. NDVI composite)


Roman et al. (2009) index


St

1.18759885321

Rcv

0.155836051603

Rse

0.0

Rst

-0.496284542509

Rsv

1.8739849102


NDVI range @ 1km [-]

0.03

NDVI range @ 2km [-]

0.08

NDVI range @ 5km [-]

0.13

NDVI range @ 10km [-]

0.2

NDVI range @ 20km [-]

0.28


Variance slope @ 1 km

0.000838519543631

Variance slope @ 2 km

0.00115386528719

Variance slope @ 5 km

0.000979226599556

Variance slope @ 10 km

0.000533672793072

Variance slope @ 20 km

0.000163384976895


NDVI (min. NDVI composite)I


Roman et al. (2009) index


St

2.23981219338e-07

Rcv

0.118774440837

Rse

0.0

Rst

0.295214542361

Rsv

13393979.7102


NDVI range @ 1km [-]

0.01

NDVI range @ 2km [-]

0.02

NDVI range @ 5km [-]

0.04

NDVI range @ 10km [-]

0.04

NDVI range @ 20km [-]

0.05


NDVI slope @ 1 km

3.32128223604e-05

NDVI slope @ 2 km

4.20221560288e-05

NDVI slope @ 5 km

3.15681577802e-05

NDVI slope @ 10 km

1.93813171378e-05

NDVI slope @ 20 km

1.0027426812e-05


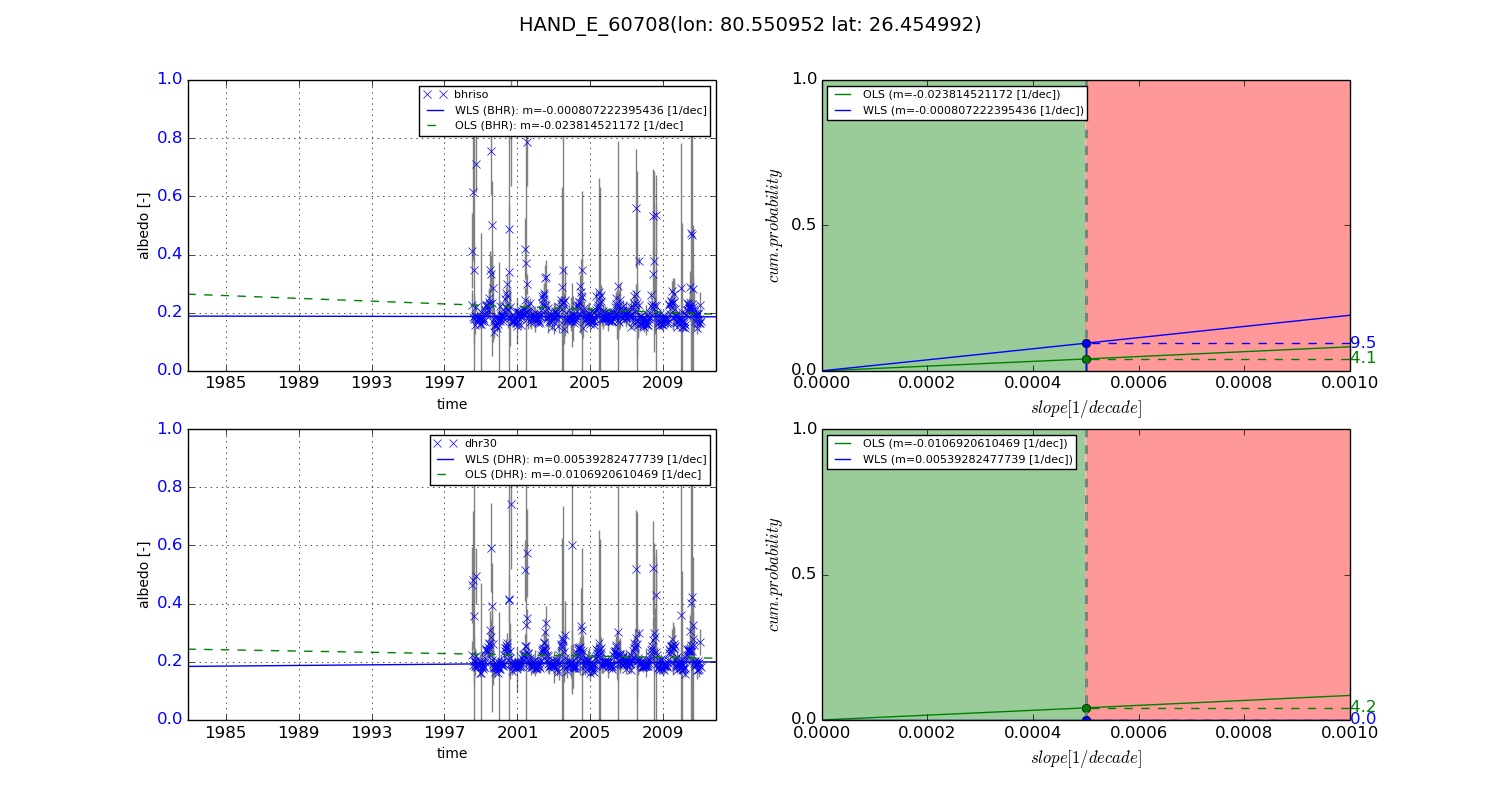
Temporal stability analysis

+000 deg (BHR)


BHR statistics

Temporal stability [1/decade]:


abs

rel


Weighted least square:

None


Ordinary least square:

None


Probabilities that GCOS criteria is met:

Weighted least square:

None %

Ordinary least square:

None %


DHR statistics

Temporal stability [1/decade]:


abs

rel


Weighted least square:

None


Ordinary least square:

None


Probabilities that GCOS criteria is met:

Weighted least square:

None %

Ordinary least square:

None %


+057/+063 deg (BHR)


BHR statistics

Temporal stability [1/decade]:


abs

rel


Weighted least square:

-0.000807222395436


Ordinary least square:

-0.023814521172


Probabilities that GCOS criteria is met:

Weighted least square:

9.5 %

Ordinary least square:

4.1 %


DHR statistics

Temporal stability [1/decade]:


abs

rel


Weighted least square:

0.00539282477739


Ordinary least square:

-0.0106920610469


Probabilities that GCOS criteria is met:

Weighted least square:

0.0 %

Ordinary least square:

4.2 %


Temporal anomaly analyis

The variance of the temporal anomalies provides an additional measure about the stability of the signal AFTER removal of the mean seasonal cylce.

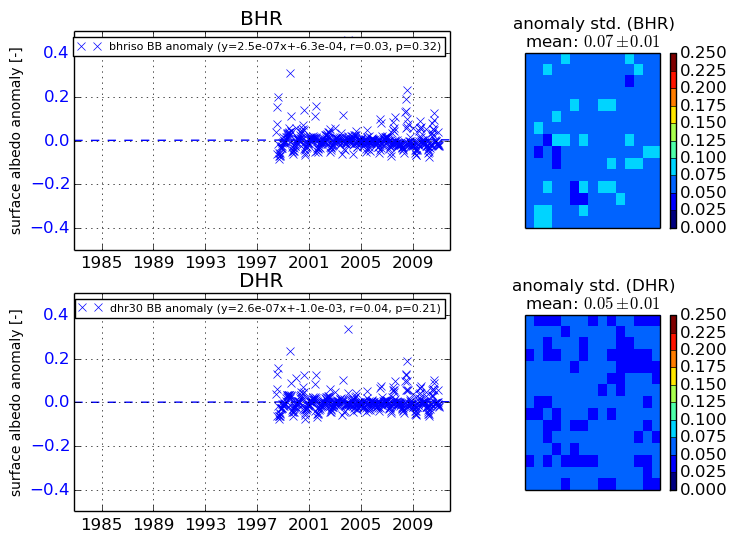
+000 deg


+057/+063 deg