HJANDREWS


Location

lon / lat [deg]: -122.2239 / 44.2386

Source network: AERONET


Geostationary surface albedo (GSA) data


“+000”


“+057/+063”


Landcover information (based on ESA CCI landcover data)


Landcover fractions @ 2km distance


Landcover fractions @ 20 km distance


Legend


Distance to open water bodies [km]:

4.93

Distance to urban areas [km]:

8.75


Radius: 1 km

Number of landcover classes:

1

Dominant landcover type:

70: Tree cover, needleleaved, evergreen, closed to open (>15%)

Fraction of dominant landcover type [%]:

100.0


Radius: 2 km

Number of landcover classes:

1

Dominant landcover type:

70: Tree cover, needleleaved, evergreen, closed to open (>15%)

Fraction of dominant landcover type [%]:

100.0


Radius: 5 km

Number of landcover classes:

1

Dominant landcover type:

70: Tree cover, needleleaved, evergreen, closed to open (>15%)

Fraction of dominant landcover type [%]:

100.0


Radius: 10 km

Number of landcover classes:

2

Dominant landcover type:

70: Tree cover, needleleaved, evergreen, closed to open (>15%)

Fraction of dominant landcover type [%]:

98.0


Radius: 20 km

Number of landcover classes:

1

Dominant landcover type:

70: Tree cover, needleleaved, evergreen, closed to open (>15%)

Fraction of dominant landcover type [%]:

98.0


Disturbances


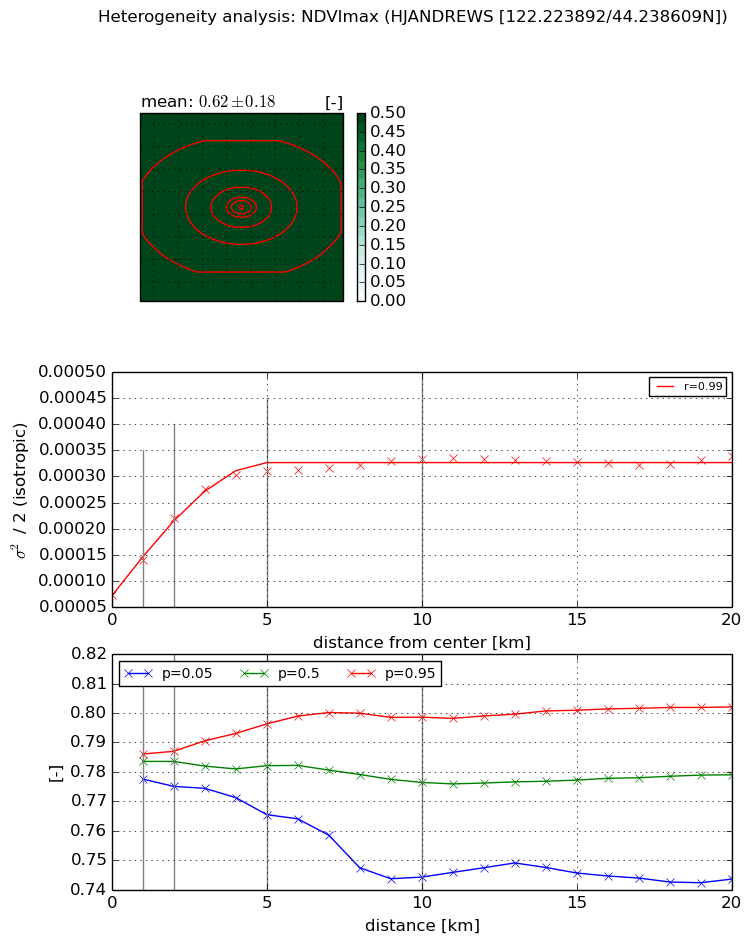
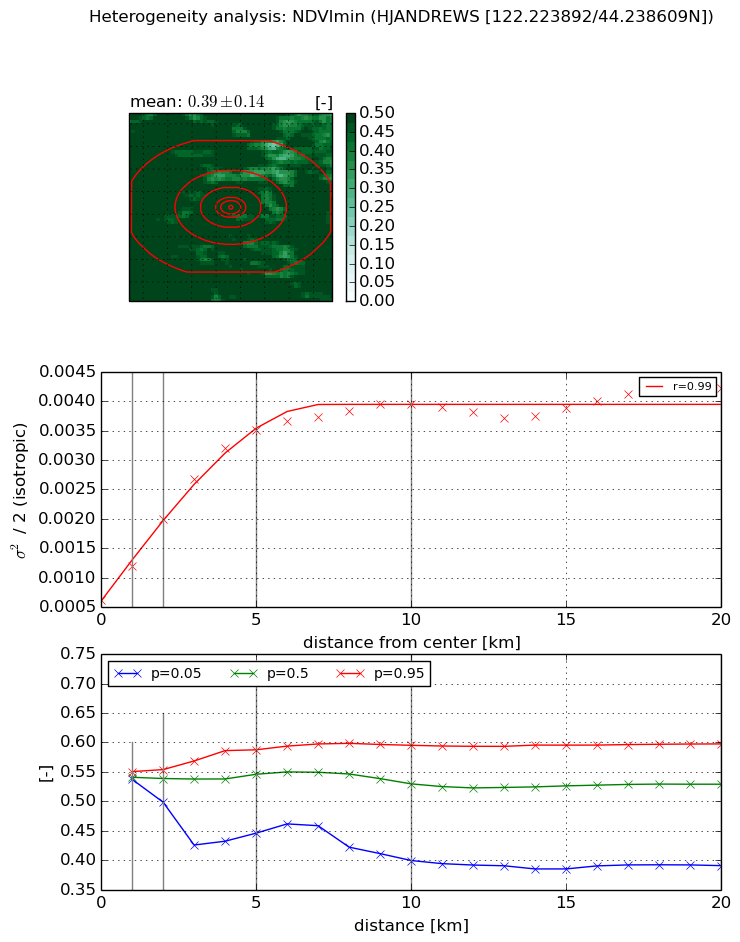
Heterogeneity analysis

The heterogeneity analysis provides information about the spatial and temporal heterogeneity of the site.

Topography


Roman et al. (2009) index


St

5.16866673855

Rcv

0.278492144241

Rse

0.0

Rst

0.125227324229

Rsv

0.176701005852


Height range @ 1km [m]

255

Height range @ 2km [m]

304

Height range @ 5km [m]

628

Height range @ 10km [m]

-999

Height range @ 20km [m]

-999


Variance slope @ 1 km

16684

Variance slope @ 2 km

15615

Variance slope @ 5 km

7907

Variance slope @ 10 km

-999

Variance slope @ 20 km

-999


NDVI (max. NDVI composite)


Roman et al. (2009) index


St

1.39546066983

Rcv

0.830226440164

Rse

0.0

Rst

-0.319601601788

Rsv

-0.999999656422


NDVI range @ 1km [-]

0.01

NDVI range @ 2km [-]

0.01

NDVI range @ 5km [-]

0.03

NDVI range @ 10km [-]

0.05

NDVI range @ 20km [-]

0.06


Variance slope @ 1 km

6.74005883249e-05

Variance slope @ 2 km

7.44553821459e-05

Variance slope @ 5 km

4.95598951859e-05

Variance slope @ 10 km

2.2331325636e-05

Variance slope @ 20 km

7.64695496038e-06


NDVI (min. NDVI composite)I


Roman et al. (2009) index


St

7.27098768196e-07

Rcv

0.0109054220592

Rse

0.0

Rst

0.257397226036

Rsv

4125986.6419


NDVI range @ 1km [-]

0.01

NDVI range @ 2km [-]

0.06

NDVI range @ 5km [-]

0.14

NDVI range @ 10km [-]

0.2

NDVI range @ 20km [-]

0.21


NDVI slope @ 1 km

0.000575291910736

NDVI slope @ 2 km

0.000690445342221

NDVI slope @ 5 km

0.000604780161514

NDVI slope @ 10 km

0.000325292666721

NDVI slope @ 20 km

0.000126996979921


Temporal stability analysis

+000 deg (BHR)


BHR statistics

Temporal stability [1/decade]:


abs

rel


Weighted least square:

None


Ordinary least square:

None


Probabilities that GCOS criteria is met:

Weighted least square:

None %

Ordinary least square:

None %


DHR statistics

Temporal stability [1/decade]:


abs

rel


Weighted least square:

None


Ordinary least square:

None


Probabilities that GCOS criteria is met:

Weighted least square:

None %

Ordinary least square:

None %


+057/+063 deg (BHR)


BHR statistics

Temporal stability [1/decade]:


abs

rel


Weighted least square:

None


Ordinary least square:

None


Probabilities that GCOS criteria is met:

Weighted least square:

None %

Ordinary least square:

None %


DHR statistics

Temporal stability [1/decade]:


abs

rel


Weighted least square:

None


Ordinary least square:

None


Probabilities that GCOS criteria is met:

Weighted least square:

None %

Ordinary least square:

None %


Temporal anomaly analyis

The variance of the temporal anomalies provides an additional measure about the stability of the signal AFTER removal of the mean seasonal cylce.

+000 deg


+057/+063 deg