IFT-LEIPZIG


Location

lon / lat [deg]: 12.4353 / 51.3525

Source network: AERONET


Geostationary surface albedo (GSA) data


“+000”


“+057/+063”


Landcover information (based on ESA CCI landcover data)


Landcover fractions @ 2km distance


Landcover fractions @ 20 km distance


Legend


Distance to open water bodies [km]:

7.42

Distance to urban areas [km]:

0.13


Radius: 1 km

Number of landcover classes:

1

Dominant landcover type:

190: urban areas

Fraction of dominant landcover type [%]:

100.0


Radius: 2 km

Number of landcover classes:

1

Dominant landcover type:

190: urban areas

Fraction of dominant landcover type [%]:

100.0


Radius: 5 km

Number of landcover classes:

2

Dominant landcover type:

190: urban areas

Fraction of dominant landcover type [%]:

93.0


Radius: 10 km

Number of landcover classes:

2

Dominant landcover type:

190: urban areas

Fraction of dominant landcover type [%]:

62.0


Radius: 20 km

Number of landcover classes:

6

Dominant landcover type:

10: cropland, rainfed

Fraction of dominant landcover type [%]:

58.0


Disturbances


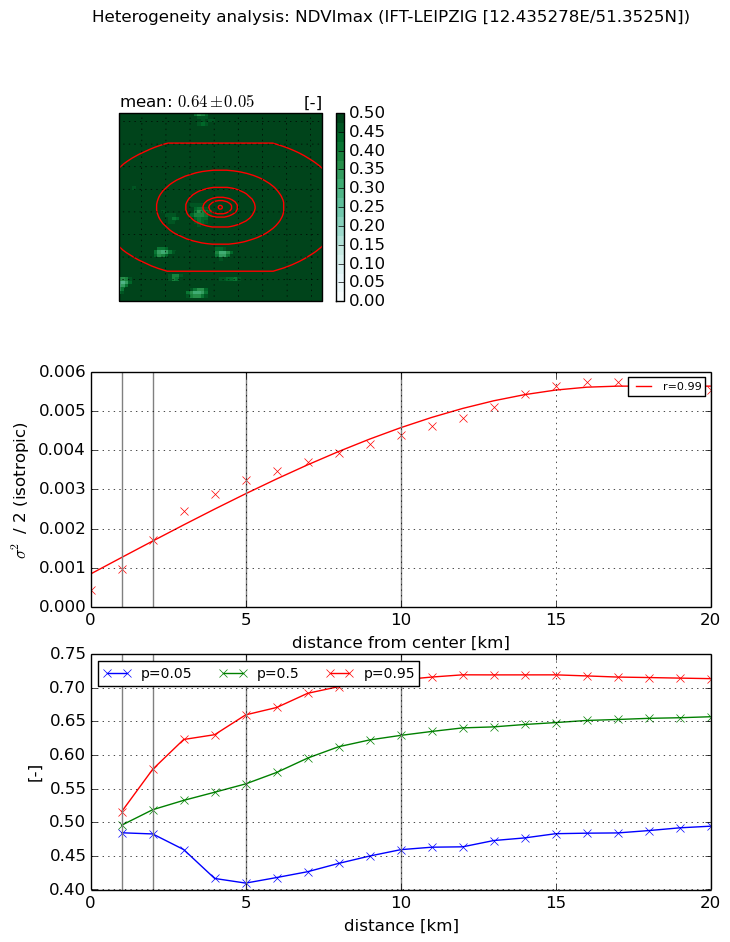
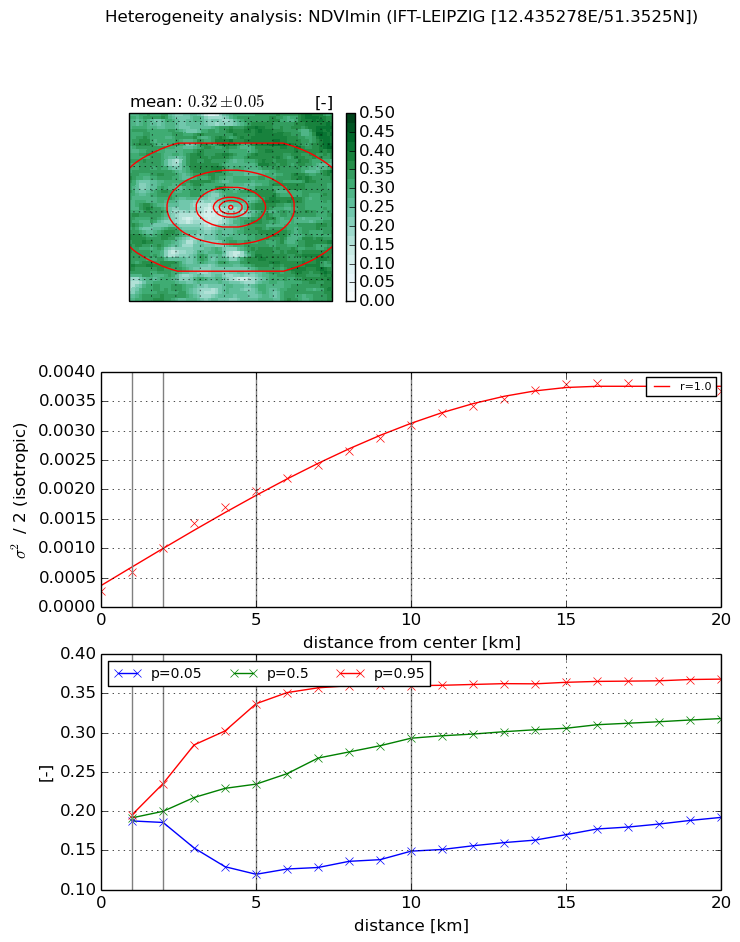
Heterogeneity analysis

The heterogeneity analysis provides information about the spatial and temporal heterogeneity of the site.

Topography


Roman et al. (2009) index


St

2.39999477745

Rcv

0.250127573016

Rse

0.0

Rst

-2.15778742859e-05

Rsv

-0.999853569195


Height range @ 1km [m]

8

Height range @ 2km [m]

15

Height range @ 5km [m]

26

Height range @ 10km [m]

-999

Height range @ 20km [m]

-999


Variance slope @ 1 km

15

Variance slope @ 2 km

15

Variance slope @ 5 km

13

Variance slope @ 10 km

-999

Variance slope @ 20 km

-999


NDVI (max. NDVI composite)


Roman et al. (2009) index


St

0.00620036867296

Rcv

0.44185307903

Rse

0.0

Rst

2.3728659686e-06

Rsv

483.400341397


NDVI range @ 1km [-]

0.03

NDVI range @ 2km [-]

0.1

NDVI range @ 5km [-]

0.25

NDVI range @ 10km [-]

0.25

NDVI range @ 20km [-]

0.22


Variance slope @ 1 km

0.000542687051677

Variance slope @ 2 km

0.000639601282737

Variance slope @ 5 km

0.000586173990897

Variance slope @ 10 km

0.000385126908513

Variance slope @ 20 km

0.000248595618602


NDVI (min. NDVI composite)I


Roman et al. (2009) index


St

1.99441047906

Rcv

0.52076600647

Rse

0.0

Rst

-9.24491584786e-07

Rsv

-0.983436958611


NDVI range @ 1km [-]

0.01

NDVI range @ 2km [-]

0.05

NDVI range @ 5km [-]

0.22

NDVI range @ 10km [-]

0.21

NDVI range @ 20km [-]

0.18


NDVI slope @ 1 km

0.00032449003637

NDVI slope @ 2 km

0.000367209363559

NDVI slope @ 5 km

0.000347405204125

NDVI slope @ 10 km

0.000278377264772

NDVI slope @ 20 km

0.000173605597975


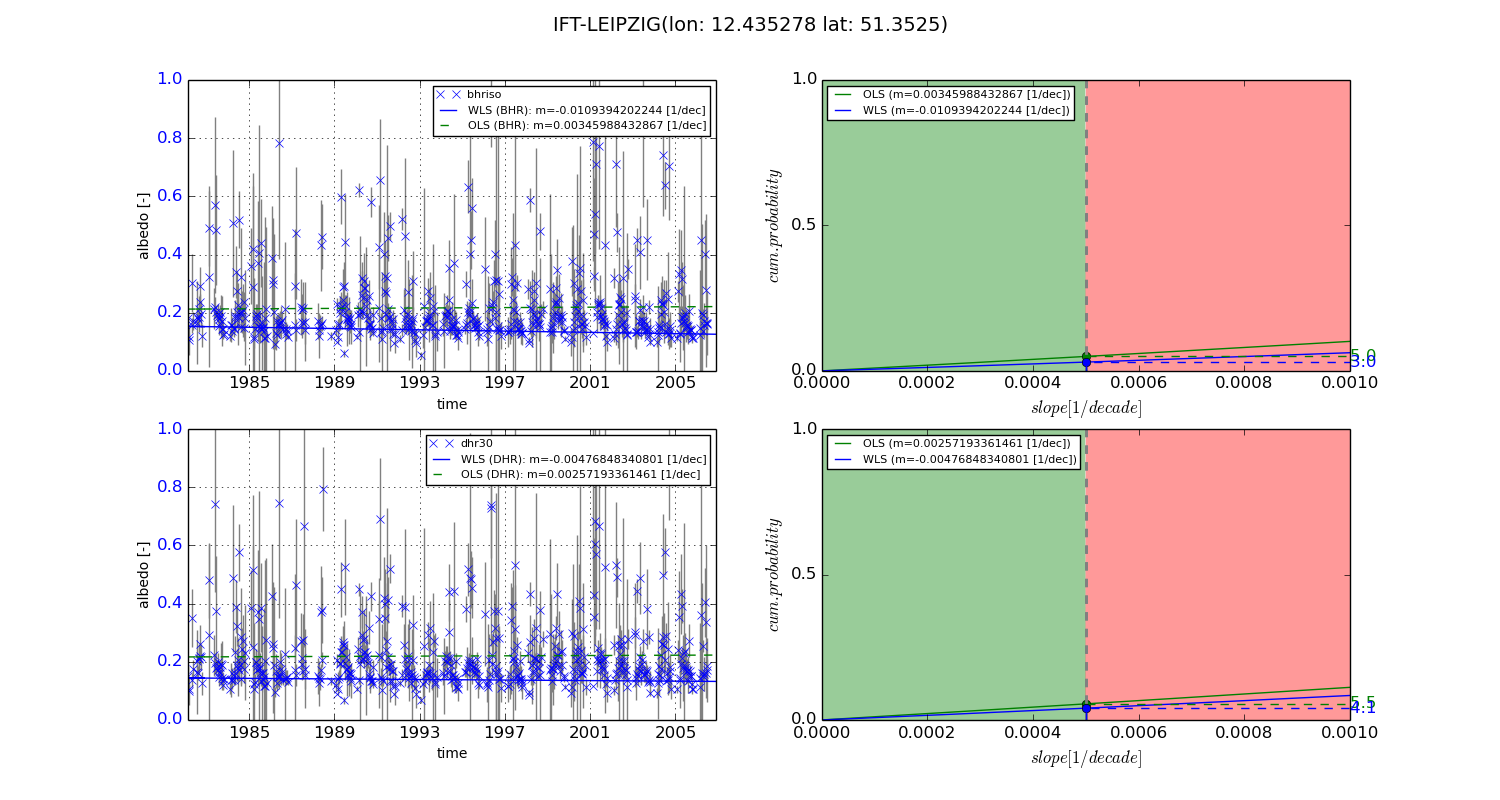
Temporal stability analysis

+000 deg (BHR)


BHR statistics

Temporal stability [1/decade]:


abs

rel


Weighted least square:

-0.0109394202244


Ordinary least square:

0.00345988432867


Probabilities that GCOS criteria is met:

Weighted least square:

3.0 %

Ordinary least square:

5.0 %


DHR statistics

Temporal stability [1/decade]:


abs

rel


Weighted least square:

-0.00476848340801


Ordinary least square:

0.00257193361461


Probabilities that GCOS criteria is met:

Weighted least square:

4.1 %

Ordinary least square:

5.5 %


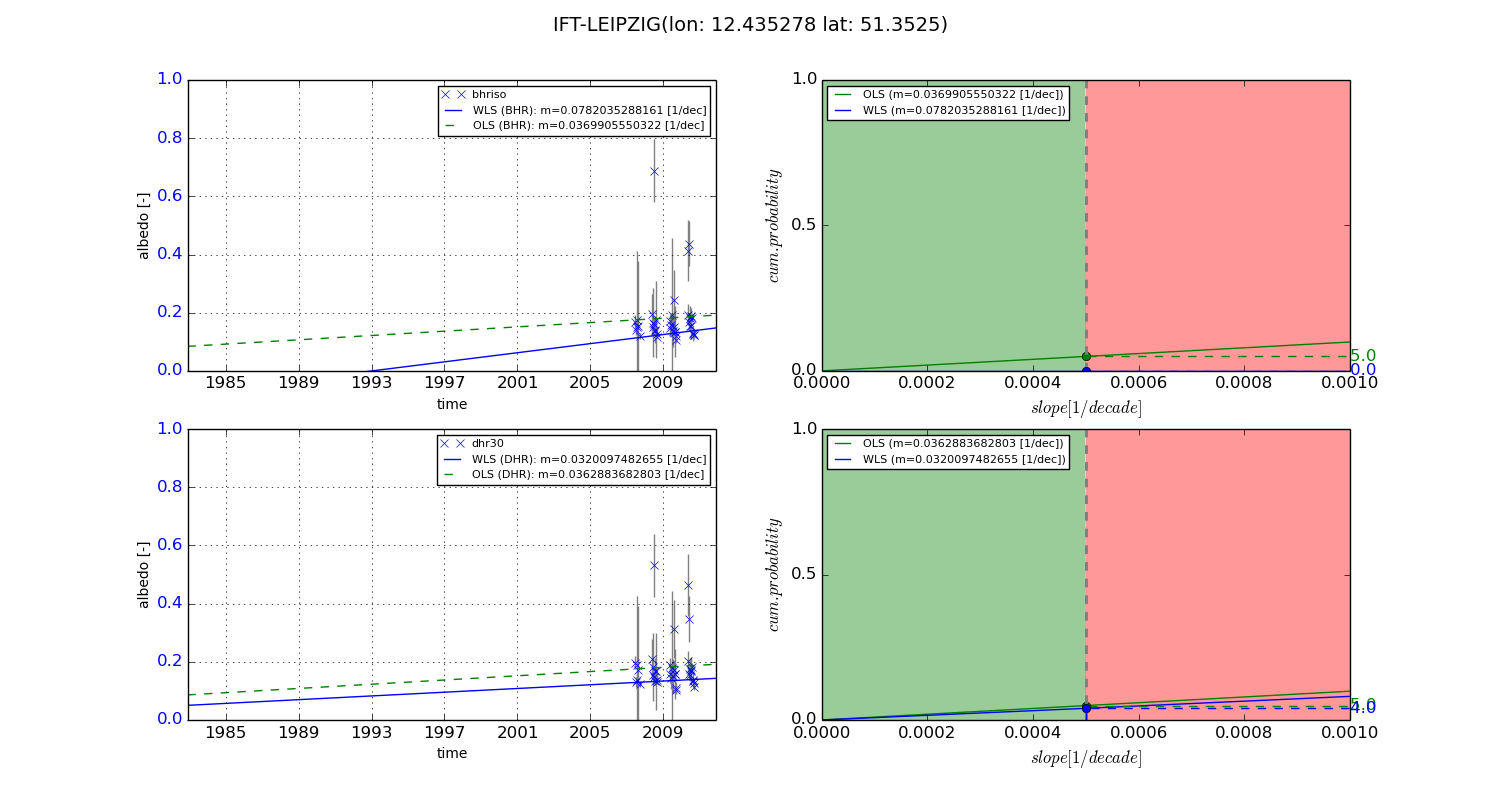
+057/+063 deg (BHR)


BHR statistics

Temporal stability [1/decade]:


abs

rel


Weighted least square:

0.0782035288161


Ordinary least square:

0.0369905550322


Probabilities that GCOS criteria is met:

Weighted least square:

0.0 %

Ordinary least square:

5.0 %


DHR statistics

Temporal stability [1/decade]:


abs

rel


Weighted least square:

0.0320097482655


Ordinary least square:

0.0362883682803


Probabilities that GCOS criteria is met:

Weighted least square:

4.0 %

Ordinary least square:

5.0 %


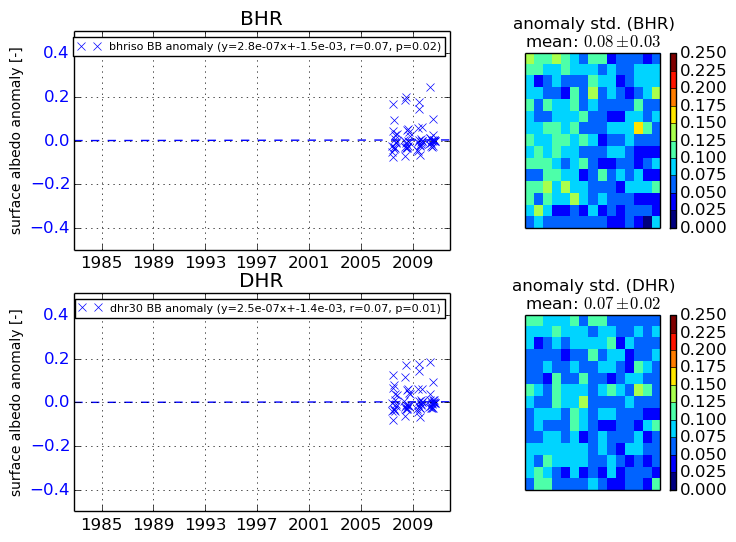
Temporal anomaly analyis

The variance of the temporal anomalies provides an additional measure about the stability of the signal AFTER removal of the mean seasonal cylce.
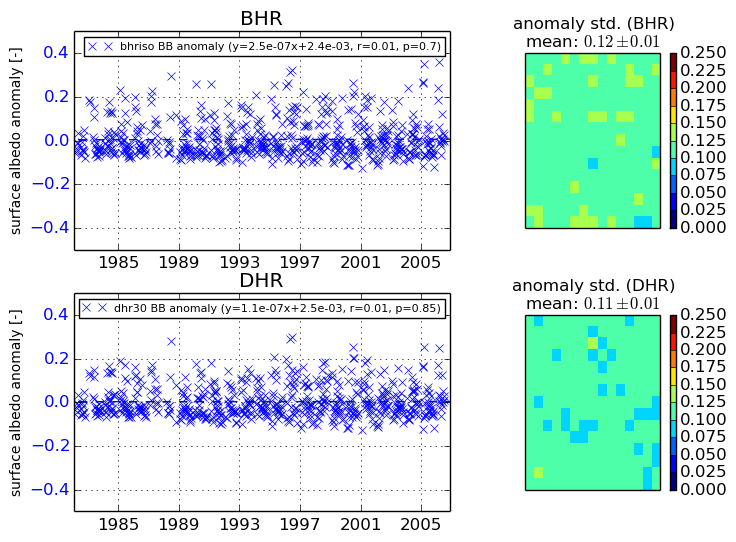
+000 deg


+057/+063 deg