IL-YAT


Location

lon / lat [deg]: 35.0515 / 31.345

Source network: FLUXNET


Geostationary surface albedo (GSA) data


“+000”


“+057/+063”


Landcover information (based on ESA CCI landcover data)


Landcover fractions @ 2km distance


Landcover fractions @ 20 km distance


Legend


Distance to open water bodies [km]:

24.34

Distance to urban areas [km]:

6.25


Radius: 1 km

Number of landcover classes:

6

Dominant landcover type:

10: cropland, rainfed

Fraction of dominant landcover type [%]:

39.0


Radius: 2 km

Number of landcover classes:

7

Dominant landcover type:

10: cropland, rainfed

Fraction of dominant landcover type [%]:

54.0


Radius: 5 km

Number of landcover classes:

6

Dominant landcover type:

150: Sparse vegetation (tree, shrub, herbaceous cover) (<15%)

Fraction of dominant landcover type [%]:

62.0


Radius: 10 km

Number of landcover classes:

3

Dominant landcover type:

150: Sparse vegetation (tree, shrub, herbaceous cover) (<15%)

Fraction of dominant landcover type [%]:

62.0


Radius: 20 km

Number of landcover classes:

4

Dominant landcover type:

200: bare areas

Fraction of dominant landcover type [%]:

48.0


Disturbances


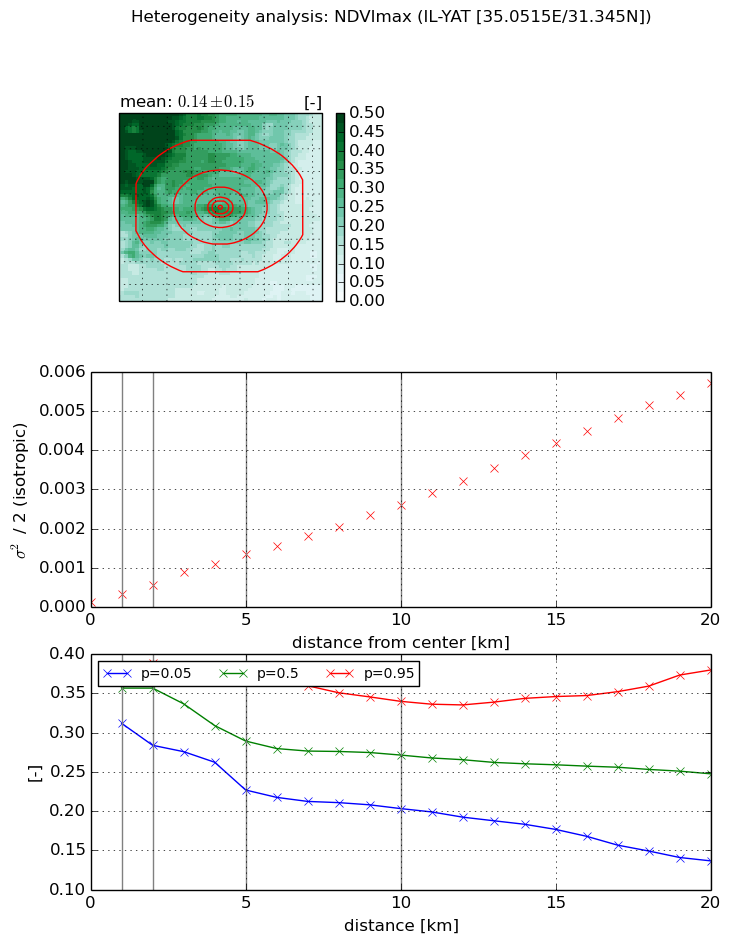
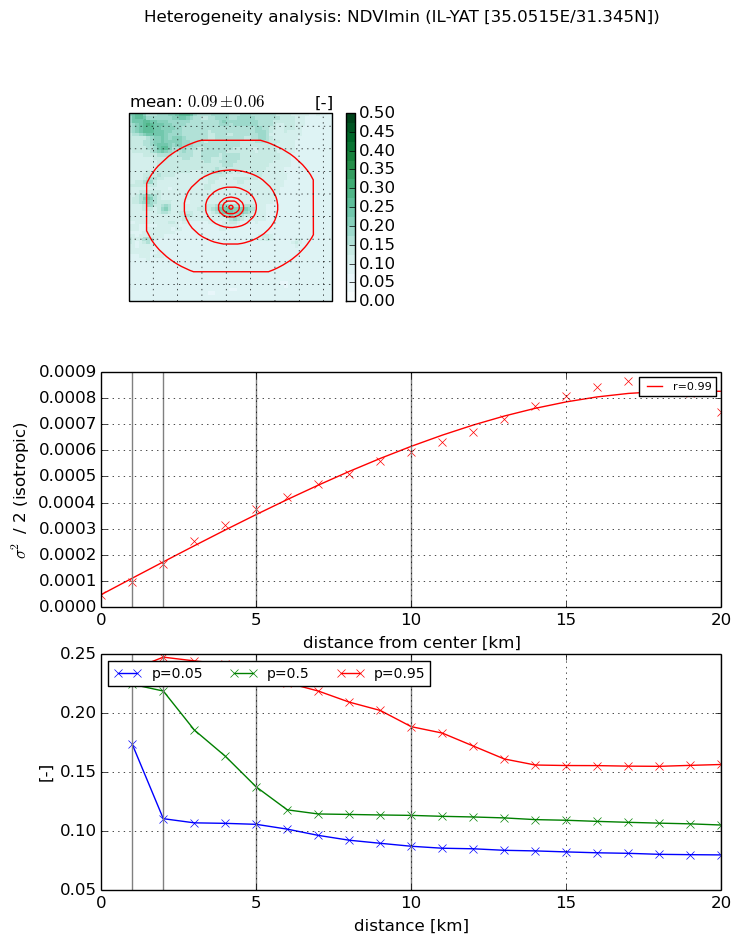
Heterogeneity analysis

The heterogeneity analysis provides information about the spatial and temporal heterogeneity of the site.

Topography


Roman et al. (2009) index


St

7.61477621743e-13

Rcv

0.665607221201

Rse

0.0

Rst

6.30903993493e-08

Rsv

3.93970868524e+12


Height range @ 1km [m]

62

Height range @ 2km [m]

107

Height range @ 5km [m]

267

Height range @ 10km [m]

-999

Height range @ 20km [m]

-999


Variance slope @ 1 km

926

Variance slope @ 2 km

983

Variance slope @ 5 km

1174

Variance slope @ 10 km

-999

Variance slope @ 20 km

-999


NDVI (max. NDVI composite)


Roman et al. (2009) index


St

5.23194003115

Rcv

0.271748459065

Rse

0.0

Rst

-0.272356356331

Rsv

-0.0292962523025


NDVI range @ 1km [-]

0.06

NDVI range @ 2km [-]

0.11

NDVI range @ 5km [-]

0.15

NDVI range @ 10km [-]

0.14

NDVI range @ 20km [-]

0.24


Variance slope @ 1 km

0.000187156611042

Variance slope @ 2 km

0.000211795503759

Variance slope @ 5 km

0.000250952618404

Variance slope @ 10 km

0.000247545234718

Variance slope @ 20 km

0.000282756462037


NDVI (min. NDVI composite)I


Roman et al. (2009) index


St

5.36866536812

Rcv

0.0991917269478

Rse

0.0

Rst

-0.301931459209

Rsv

-0.157674912494


NDVI range @ 1km [-]

0.06

NDVI range @ 2km [-]

0.14

NDVI range @ 5km [-]

0.13

NDVI range @ 10km [-]

0.1

NDVI range @ 20km [-]

0.08


NDVI slope @ 1 km

5.18606144218e-05

NDVI slope @ 2 km

5.99108629348e-05

NDVI slope @ 5 km

6.83968003369e-05

NDVI slope @ 10 km

5.61165260167e-05

NDVI slope @ 20 km

4.05517463818e-05


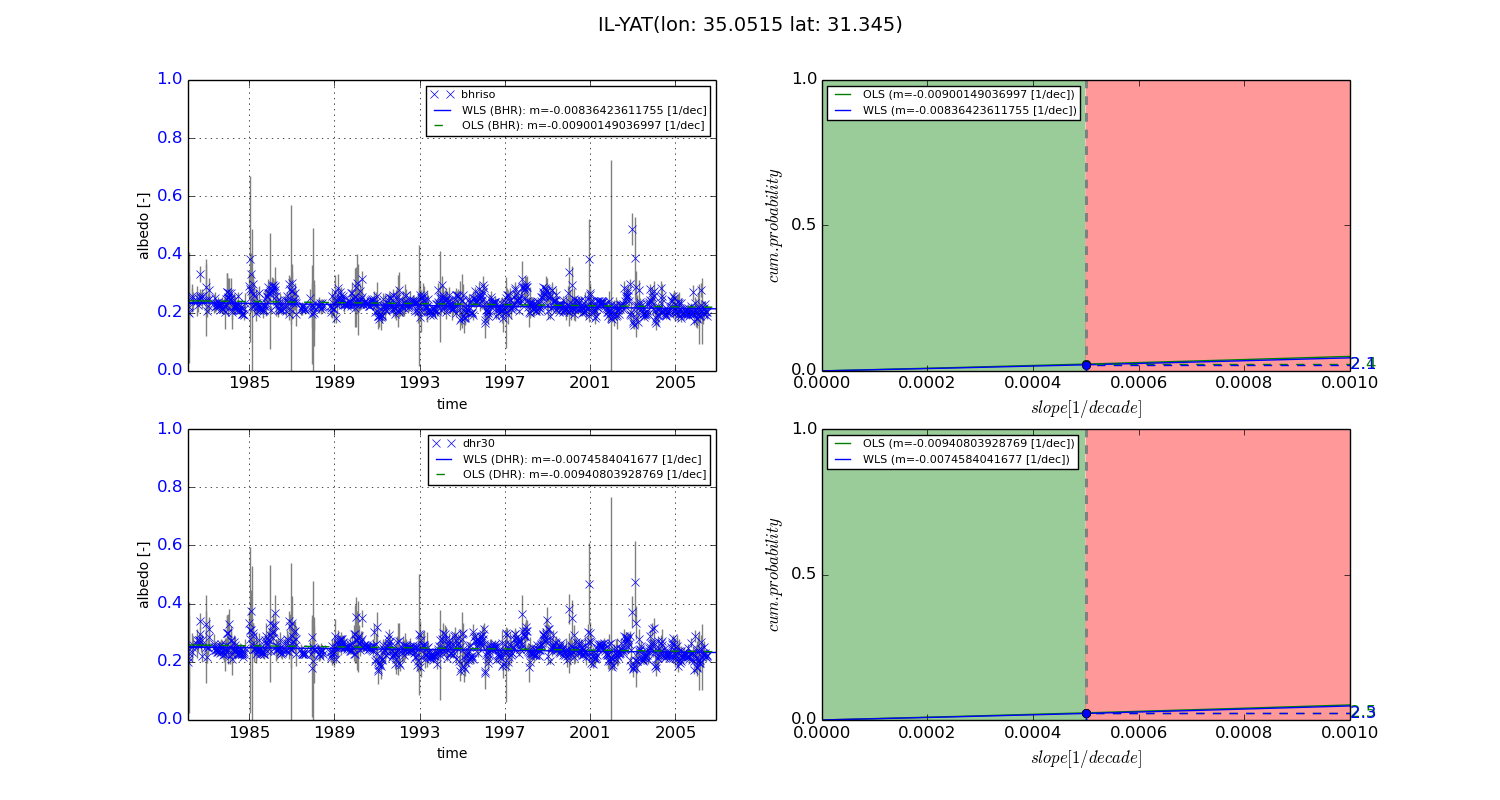
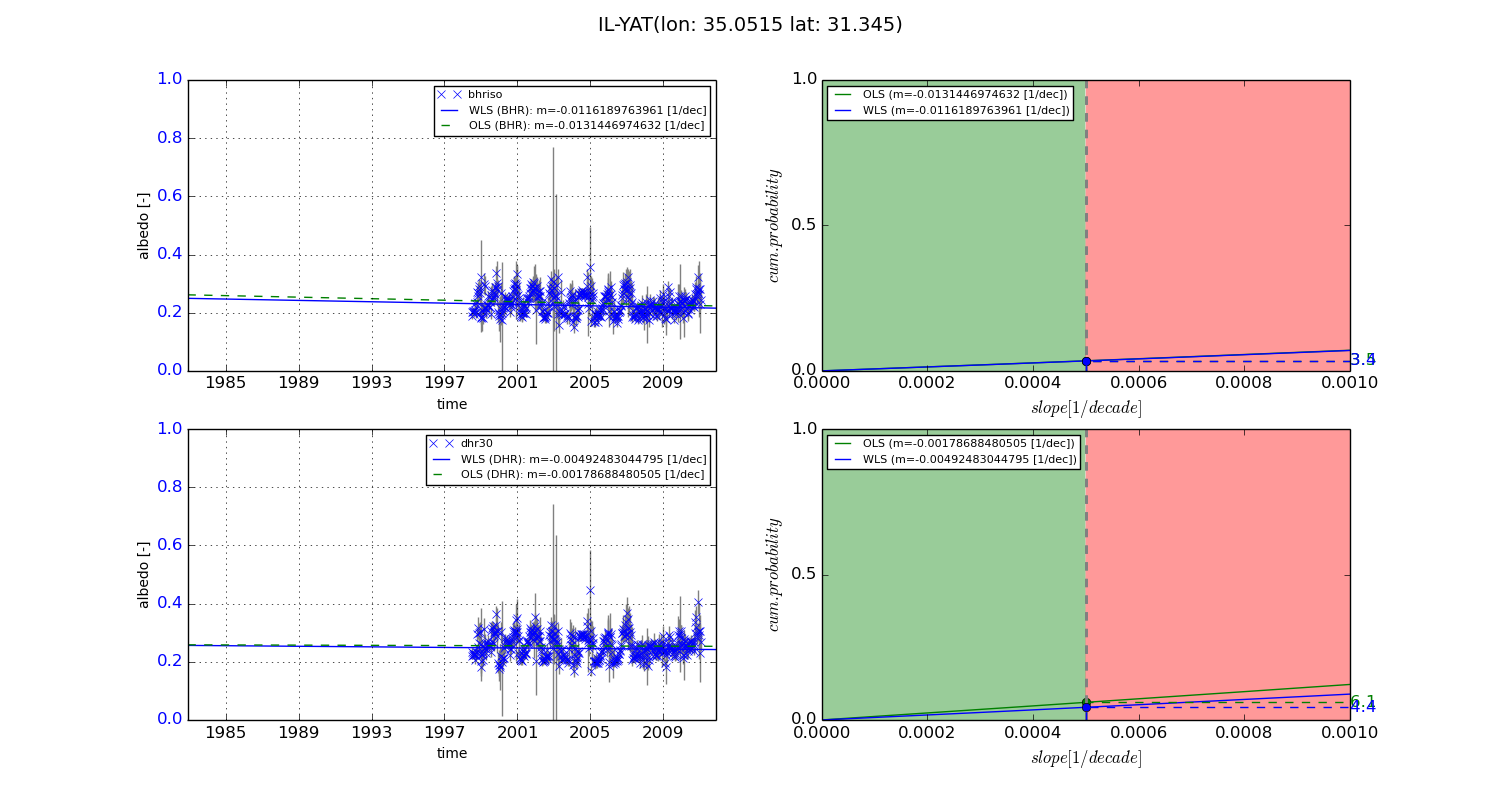
Temporal stability analysis

+000 deg (BHR)


BHR statistics

Temporal stability [1/decade]:


abs

rel


Weighted least square:

-0.00836423611755


Ordinary least square:

-0.00900149036997


Probabilities that GCOS criteria is met:

Weighted least square:

2.1 %

Ordinary least square:

2.4 %


DHR statistics

Temporal stability [1/decade]:


abs

rel


Weighted least square:

-0.0074584041677


Ordinary least square:

-0.00940803928769


Probabilities that GCOS criteria is met:

Weighted least square:

2.3 %

Ordinary least square:

2.5 %


+057/+063 deg (BHR)


BHR statistics

Temporal stability [1/decade]:


abs

rel


Weighted least square:

-0.0116189763961


Ordinary least square:

-0.0131446974632


Probabilities that GCOS criteria is met:

Weighted least square:

3.4 %

Ordinary least square:

3.5 %


DHR statistics

Temporal stability [1/decade]:


abs

rel


Weighted least square:

-0.00492483044795


Ordinary least square:

-0.00178688480505


Probabilities that GCOS criteria is met:

Weighted least square:

4.4 %

Ordinary least square:

6.1 %


Temporal anomaly analyis

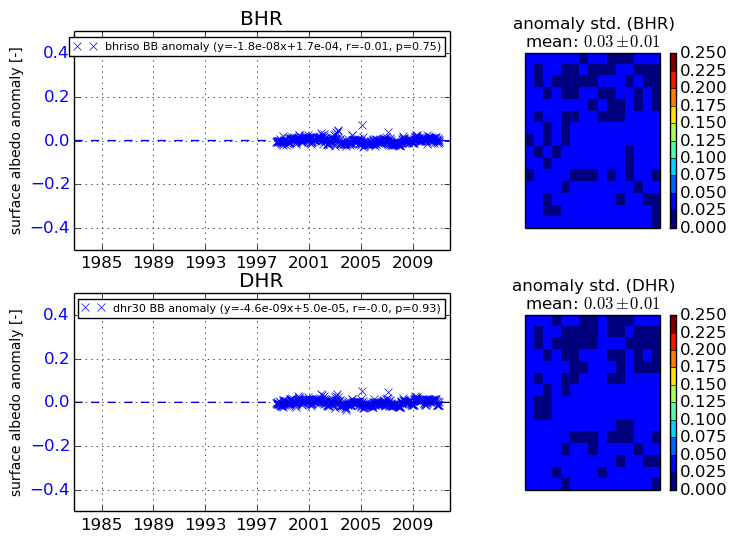
The variance of the temporal anomalies provides an additional measure about the stability of the signal AFTER removal of the mean seasonal cylce.
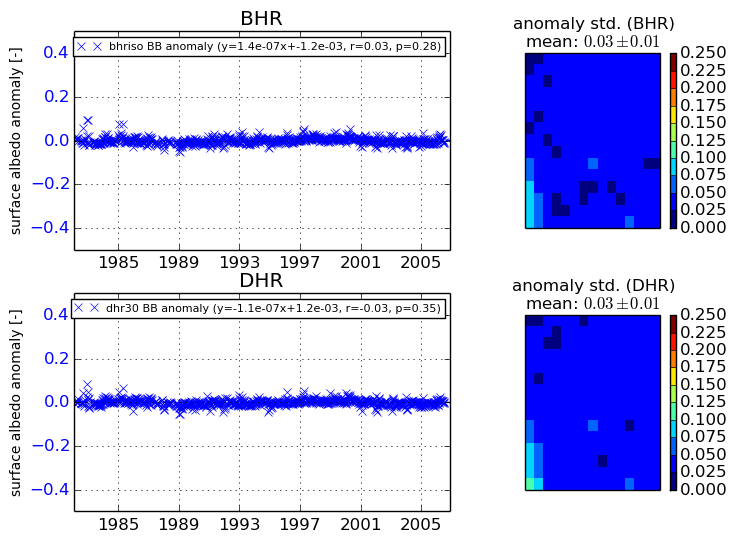
+000 deg


+057/+063 deg