IT-LAV


Location

lon / lat [deg]: 11.2812 / 45.9553

Source network: FLUXNET


Geostationary surface albedo (GSA) data


“+000”


“+057/+063”


Landcover information (based on ESA CCI landcover data)


Landcover fractions @ 2km distance


Landcover fractions @ 20 km distance


Legend


Distance to open water bodies [km]:

5.76

Distance to urban areas [km]:

1.78


Radius: 1 km

Number of landcover classes:

2

Dominant landcover type:

70: Tree cover, needleleaved, evergreen, closed to open (>15%)

Fraction of dominant landcover type [%]:

85.0


Radius: 2 km

Number of landcover classes:

6

Dominant landcover type:

70: Tree cover, needleleaved, evergreen, closed to open (>15%)

Fraction of dominant landcover type [%]:

59.0


Radius: 5 km

Number of landcover classes:

9

Dominant landcover type:

70: Tree cover, needleleaved, evergreen, closed to open (>15%)

Fraction of dominant landcover type [%]:

37.0


Radius: 10 km

Number of landcover classes:

9

Dominant landcover type:

70: Tree cover, needleleaved, evergreen, closed to open (>15%)

Fraction of dominant landcover type [%]:

39.0


Radius: 20 km

Number of landcover classes:

8

Dominant landcover type:

70: Tree cover, needleleaved, evergreen, closed to open (>15%)

Fraction of dominant landcover type [%]:

29.0


Disturbances


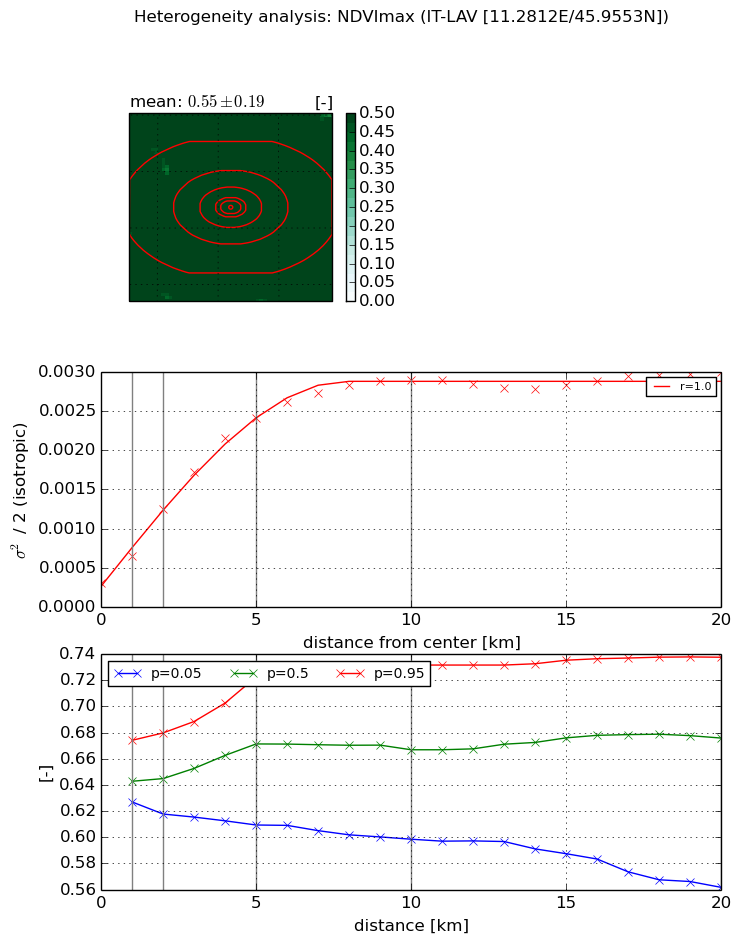
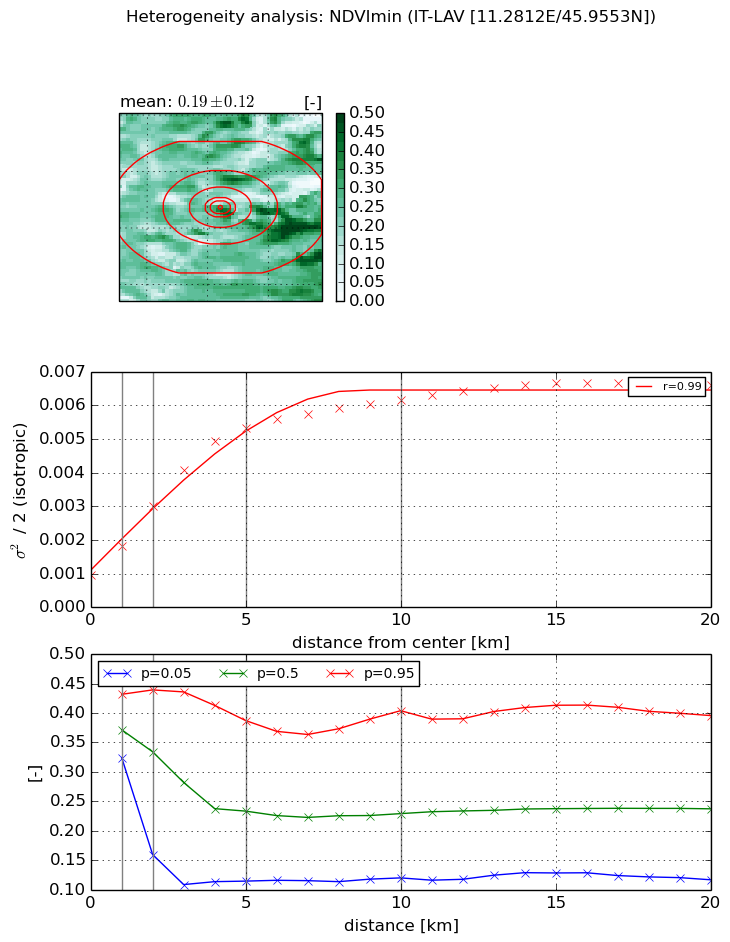
Heterogeneity analysis

The heterogeneity analysis provides information about the spatial and temporal heterogeneity of the site.

Topography


Roman et al. (2009) index


St

8.57486345124e-07

Rcv

1.04635882864

Rse

0.0

Rst

0.0564815912

Rsv

3498596.88307


Height range @ 1km [m]

172

Height range @ 2km [m]

302

Height range @ 5km [m]

1005

Height range @ 10km [m]

-999

Height range @ 20km [m]

-999


Variance slope @ 1 km

23657

Variance slope @ 2 km

27718

Variance slope @ 5 km

27688

Variance slope @ 10 km

-999

Variance slope @ 20 km

-999


NDVI (max. NDVI composite)


Roman et al. (2009) index


St

3.24527657284

Rcv

0.342133569897

Rse

0.0

Rst

-0.0752677796731

Rsv

0.507019091236


NDVI range @ 1km [-]

0.05

NDVI range @ 2km [-]

0.06

NDVI range @ 5km [-]

0.11

NDVI range @ 10km [-]

0.13

NDVI range @ 20km [-]

0.18


Variance slope @ 1 km

0.000355468636283

Variance slope @ 2 km

0.000473341694216

Variance slope @ 5 km

0.000443801327284

Variance slope @ 10 km

0.00026435150689

Variance slope @ 20 km

0.00010036181087


NDVI (min. NDVI composite)I


Roman et al. (2009) index


St

7.51734232956

Rcv

-0.155867012578

Rse

0.0

Rst

-0.0164230620861

Rsv

-0.22678713487


NDVI range @ 1km [-]

0.11

NDVI range @ 2km [-]

0.28

NDVI range @ 5km [-]

0.27

NDVI range @ 10km [-]

0.28

NDVI range @ 20km [-]

0.28


NDVI slope @ 1 km

0.000840994497103

NDVI slope @ 2 km

0.0010259845484

NDVI slope @ 5 km

0.000920661086361

NDVI slope @ 10 km

0.000505856893256

NDVI slope @ 20 km

0.000224870592028


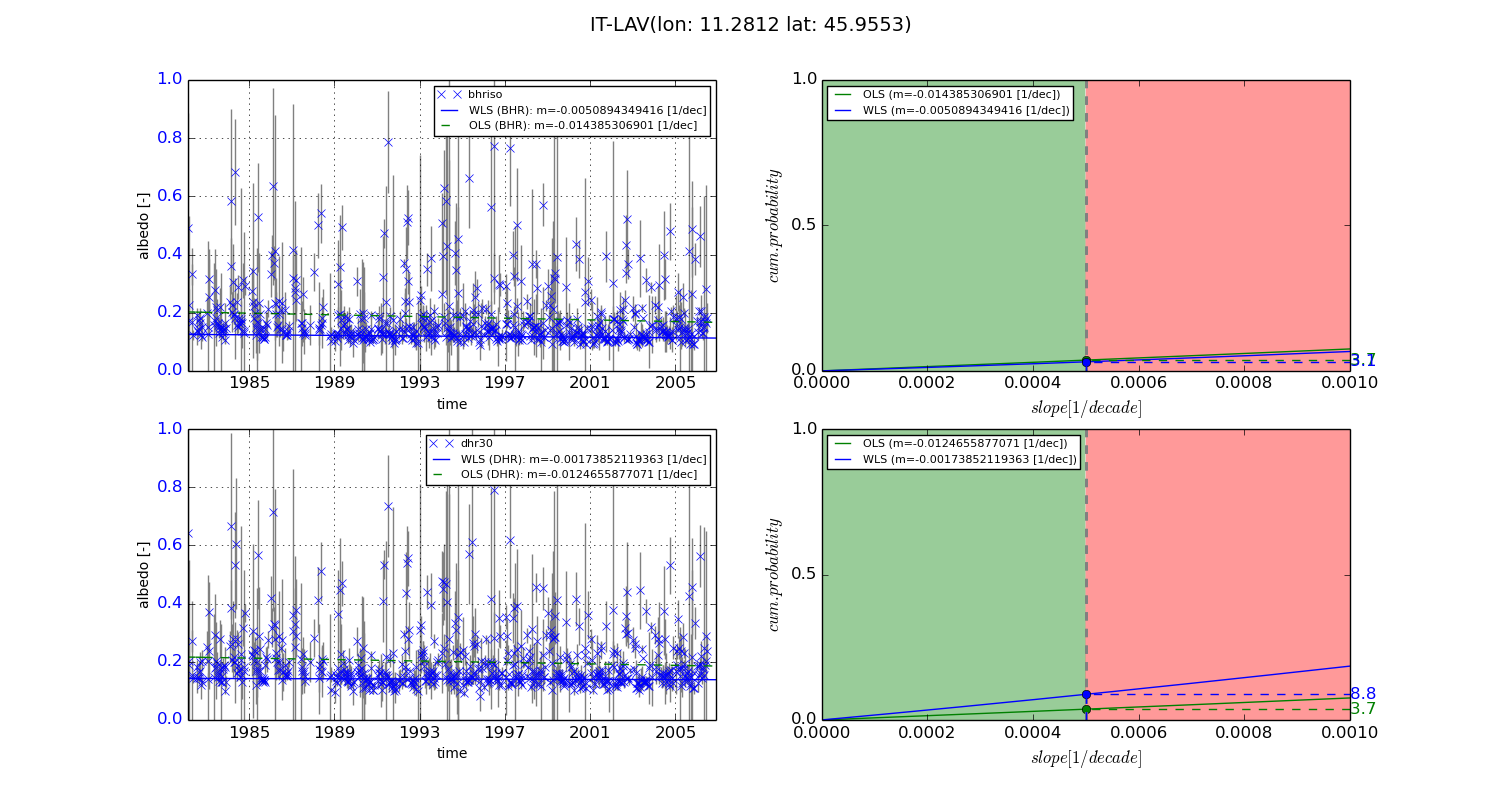
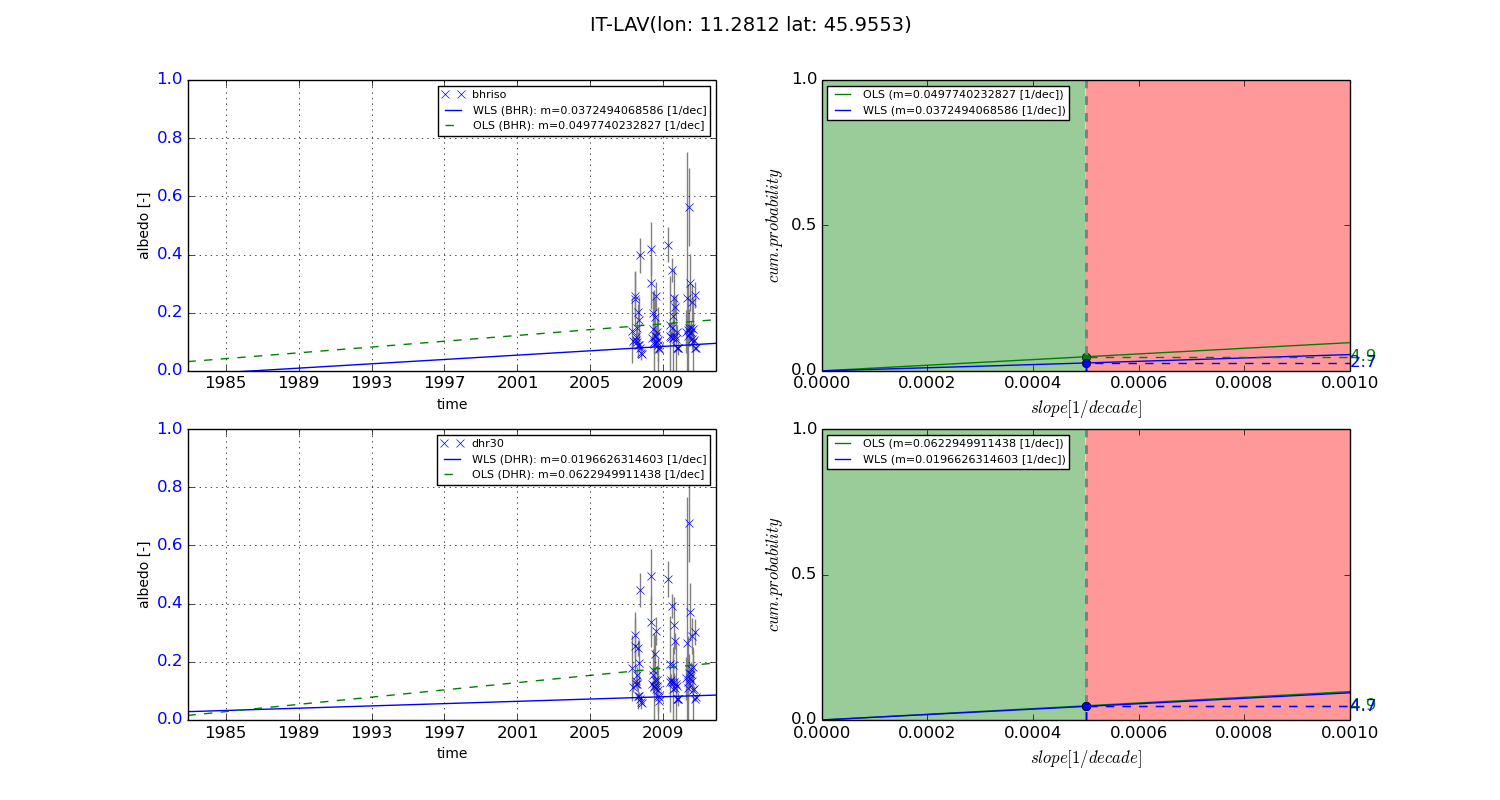
Temporal stability analysis

+000 deg (BHR)


BHR statistics

Temporal stability [1/decade]:


abs

rel


Weighted least square:

-0.0050894349416


Ordinary least square:

-0.014385306901


Probabilities that GCOS criteria is met:

Weighted least square:

3.1 %

Ordinary least square:

3.7 %


DHR statistics

Temporal stability [1/decade]:


abs

rel


Weighted least square:

-0.00173852119363


Ordinary least square:

-0.0124655877071


Probabilities that GCOS criteria is met:

Weighted least square:

8.8 %

Ordinary least square:

3.7 %


+057/+063 deg (BHR)


BHR statistics

Temporal stability [1/decade]:


abs

rel


Weighted least square:

0.0372494068586


Ordinary least square:

0.0497740232827


Probabilities that GCOS criteria is met:

Weighted least square:

2.7 %

Ordinary least square:

4.9 %


DHR statistics

Temporal stability [1/decade]:


abs

rel


Weighted least square:

0.0196626314603


Ordinary least square:

0.0622949911438


Probabilities that GCOS criteria is met:

Weighted least square:

4.7 %

Ordinary least square:

4.9 %


Temporal anomaly analyis

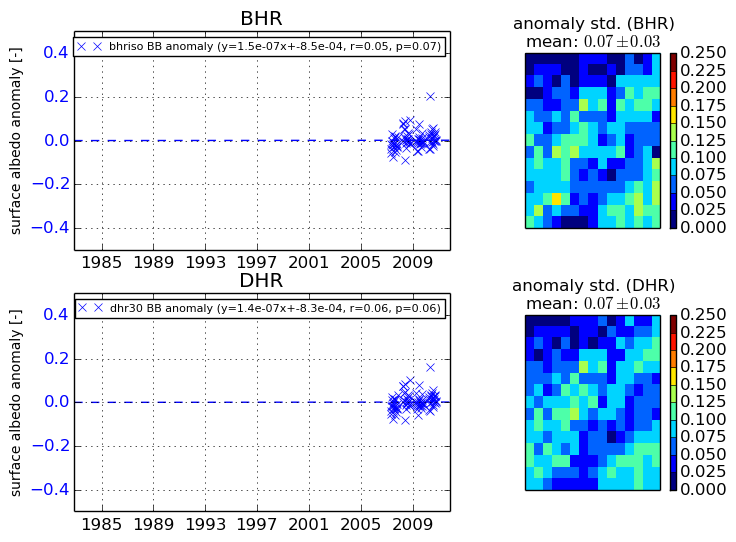
The variance of the temporal anomalies provides an additional measure about the stability of the signal AFTER removal of the mean seasonal cylce.
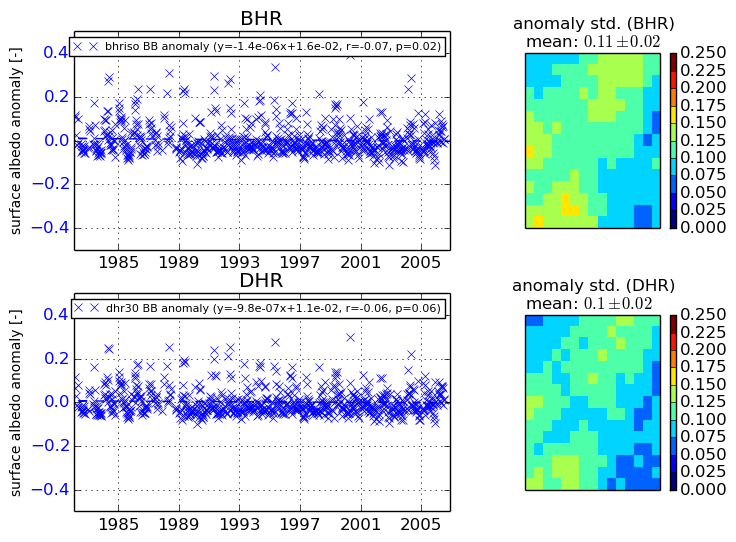
+000 deg


+057/+063 deg