IT-PT1


Location

lon / lat [deg]: 9.061 / 45.2009

Source network: FLUXNET


Geostationary surface albedo (GSA) data


“+000”


“+057/+063”


Landcover information (based on ESA CCI landcover data)


Landcover fractions @ 2km distance


Landcover fractions @ 20 km distance


Legend


Distance to open water bodies [km]:

0.68

Distance to urban areas [km]:

2.76


Radius: 1 km

Number of landcover classes:

8

Dominant landcover type:

10: cropland, rainfed

Fraction of dominant landcover type [%]:

30.0


Radius: 2 km

Number of landcover classes:

9

Dominant landcover type:

20: cropland, irrigated or post-flooded

Fraction of dominant landcover type [%]:

36.0


Radius: 5 km

Number of landcover classes:

8

Dominant landcover type:

20: cropland, irrigated or post-flooded

Fraction of dominant landcover type [%]:

46.0


Radius: 10 km

Number of landcover classes:

6

Dominant landcover type:

20: cropland, irrigated or post-flooded

Fraction of dominant landcover type [%]:

45.0


Radius: 20 km

Number of landcover classes:

5

Dominant landcover type:

10: cropland, rainfed

Fraction of dominant landcover type [%]:

43.0


Disturbances


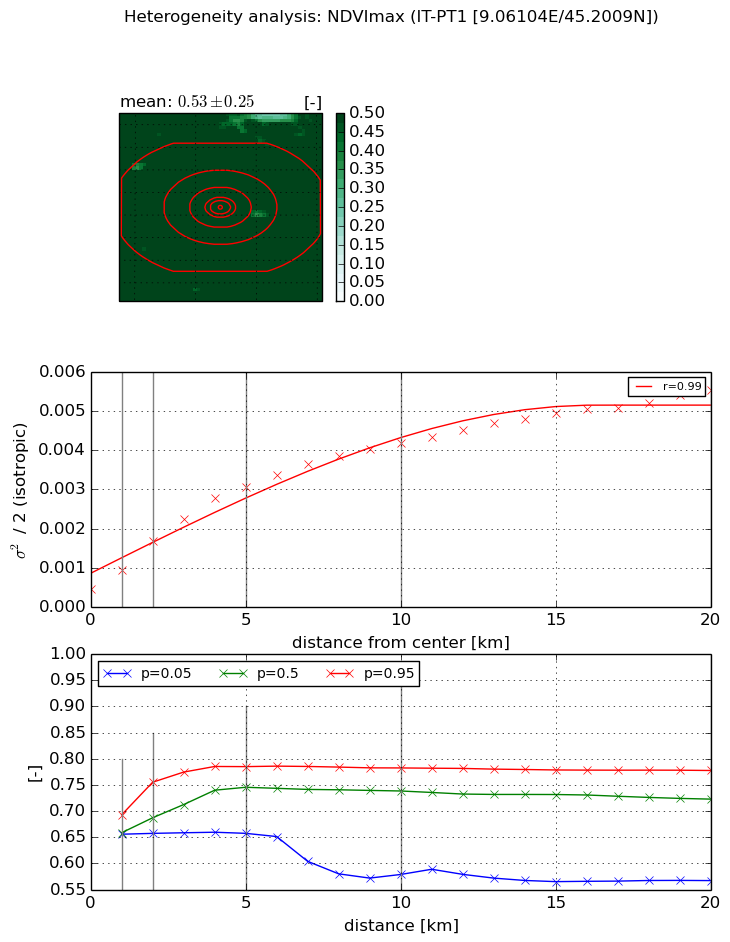
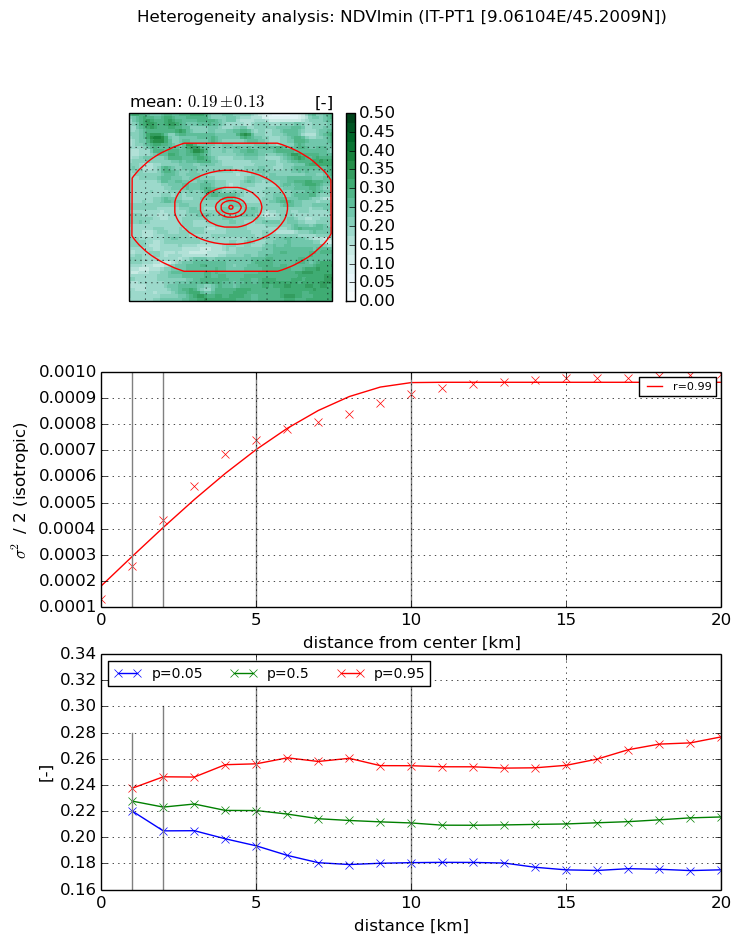
Heterogeneity analysis

The heterogeneity analysis provides information about the spatial and temporal heterogeneity of the site.

Topography


Roman et al. (2009) index


St

7.30491973486

Rcv

0.314862254747

Rse

0.0

Rst

0.047174610021

Rsv

0.0486452657537


Height range @ 1km [m]

7

Height range @ 2km [m]

16

Height range @ 5km [m]

28

Height range @ 10km [m]

-999

Height range @ 20km [m]

-999


Variance slope @ 1 km

26

Variance slope @ 2 km

27

Variance slope @ 5 km

29

Variance slope @ 10 km

-999

Variance slope @ 20 km

-999


NDVI (max. NDVI composite)


Roman et al. (2009) index


St

3.63476165403

Rcv

0.106313506947

Rse

0.0

Rst

-0.114015574775

Rsv

0.605034528206


NDVI range @ 1km [-]

0.04

NDVI range @ 2km [-]

0.1

NDVI range @ 5km [-]

0.13

NDVI range @ 10km [-]

0.2

NDVI range @ 20km [-]

0.21


Variance slope @ 1 km

0.000492391049781

Variance slope @ 2 km

0.000605110812292

Variance slope @ 5 km

0.000544795854257

Variance slope @ 10 km

0.000371074169289

Variance slope @ 20 km

0.000223873541155


NDVI (min. NDVI composite)I


Roman et al. (2009) index


St

nan

Rcv

nan

Rse

nan

Rst

nan

Rsv

nan


NDVI range @ 1km [-]

0.02

NDVI range @ 2km [-]

0.04

NDVI range @ 5km [-]

0.06

NDVI range @ 10km [-]

0.07

NDVI range @ 20km [-]

0.1


NDVI slope @ 1 km

0.000127795523162

NDVI slope @ 2 km

0.000152567662202

NDVI slope @ 5 km

0.000127081944278

NDVI slope @ 10 km

7.46999444496e-05

NDVI slope @ 20 km

3.49766205957e-05


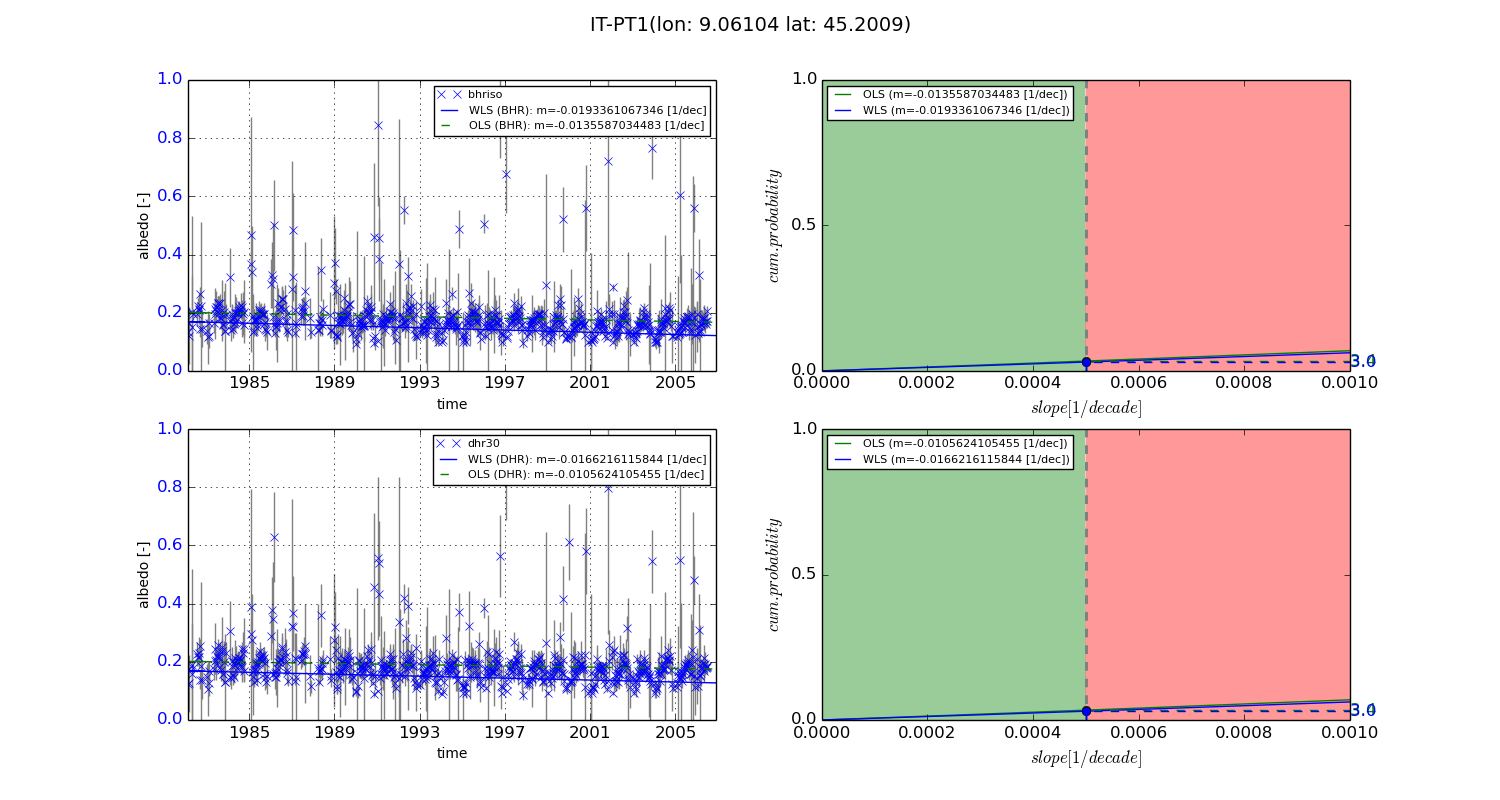
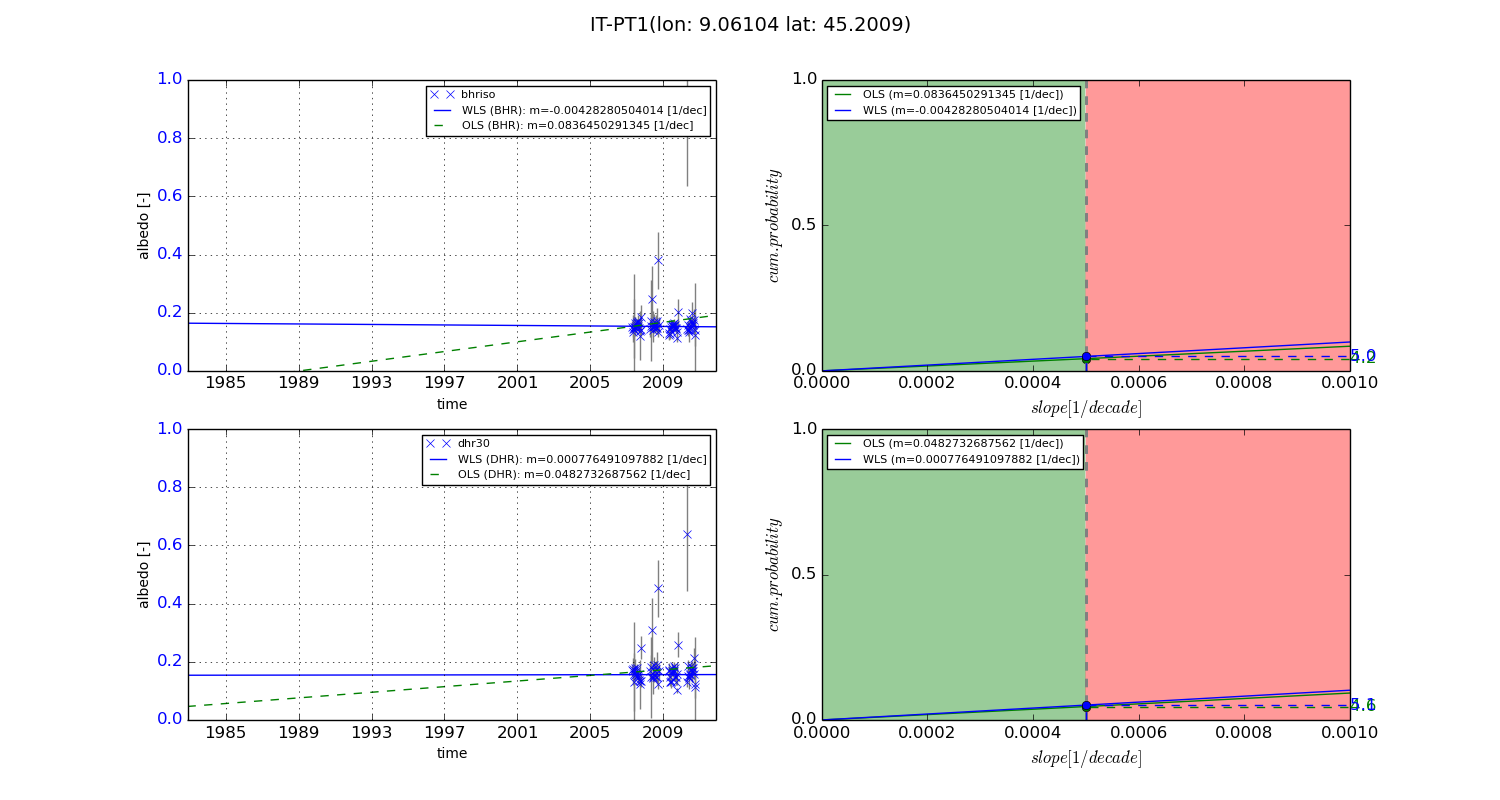
Temporal stability analysis

+000 deg (BHR)


BHR statistics

Temporal stability [1/decade]:


abs

rel


Weighted least square:

-0.0193361067346


Ordinary least square:

-0.0135587034483


Probabilities that GCOS criteria is met:

Weighted least square:

3.0 %

Ordinary least square:

3.4 %


DHR statistics

Temporal stability [1/decade]:


abs

rel


Weighted least square:

-0.0166216115844


Ordinary least square:

-0.0105624105455


Probabilities that GCOS criteria is met:

Weighted least square:

3.0 %

Ordinary least square:

3.4 %


+057/+063 deg (BHR)


BHR statistics

Temporal stability [1/decade]:


abs

rel


Weighted least square:

-0.00428280504014


Ordinary least square:

0.0836450291345


Probabilities that GCOS criteria is met:

Weighted least square:

5.0 %

Ordinary least square:

4.2 %


DHR statistics

Temporal stability [1/decade]:


abs

rel


Weighted least square:

0.000776491097882


Ordinary least square:

0.0482732687562


Probabilities that GCOS criteria is met:

Weighted least square:

5.1 %

Ordinary least square:

4.6 %


Temporal anomaly analyis

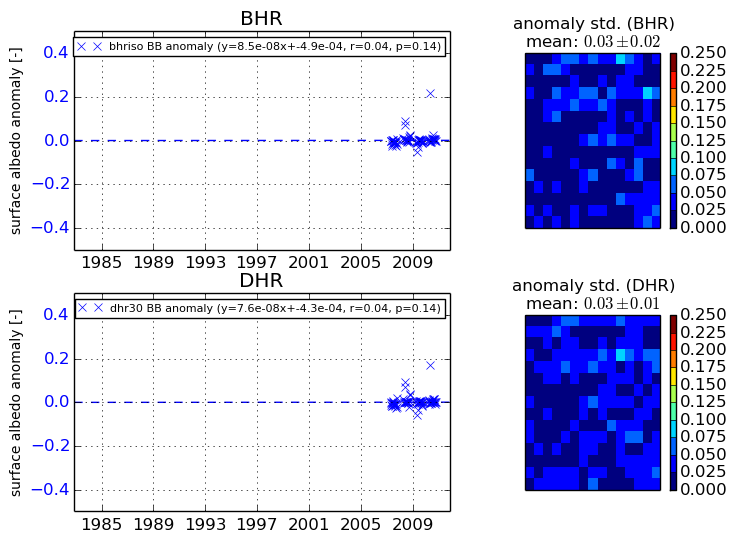
The variance of the temporal anomalies provides an additional measure about the stability of the signal AFTER removal of the mean seasonal cylce.
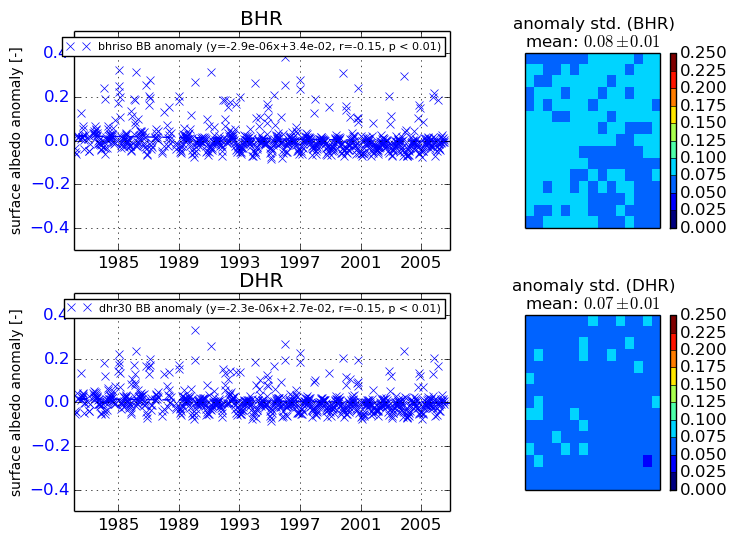
+000 deg


+057/+063 deg