JINGTAI


Location

lon / lat [deg]: 104.1 / 37.3333

Source network: AERONET


Geostationary surface albedo (GSA) data


“+000”


“+057/+063”


Landcover information (based on ESA CCI landcover data)


Landcover fractions @ 2km distance


Landcover fractions @ 20 km distance


Legend


Distance to open water bodies [km]:

23.53

Distance to urban areas [km]:

1.71


Radius: 1 km

Number of landcover classes:

2

Dominant landcover type:

130: grassland

Fraction of dominant landcover type [%]:

80.0


Radius: 2 km

Number of landcover classes:

5

Dominant landcover type:

130: grassland

Fraction of dominant landcover type [%]:

56.0


Radius: 5 km

Number of landcover classes:

4

Dominant landcover type:

130: grassland

Fraction of dominant landcover type [%]:

56.0


Radius: 10 km

Number of landcover classes:

4

Dominant landcover type:

130: grassland

Fraction of dominant landcover type [%]:

58.0


Radius: 20 km

Number of landcover classes:

6

Dominant landcover type:

130: grassland

Fraction of dominant landcover type [%]:

73.0


Disturbances


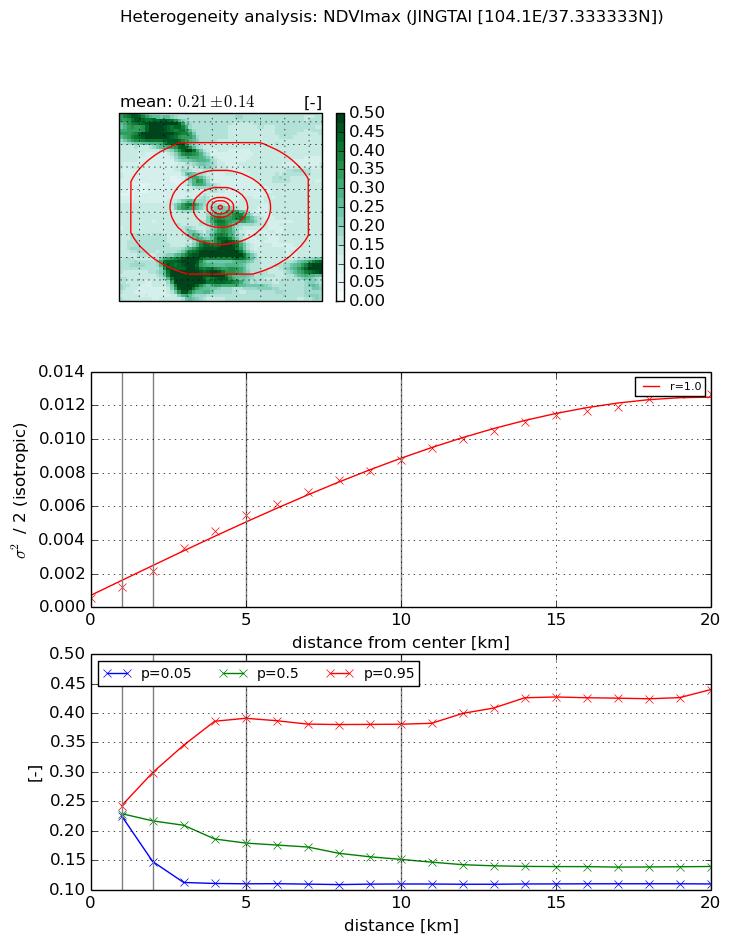
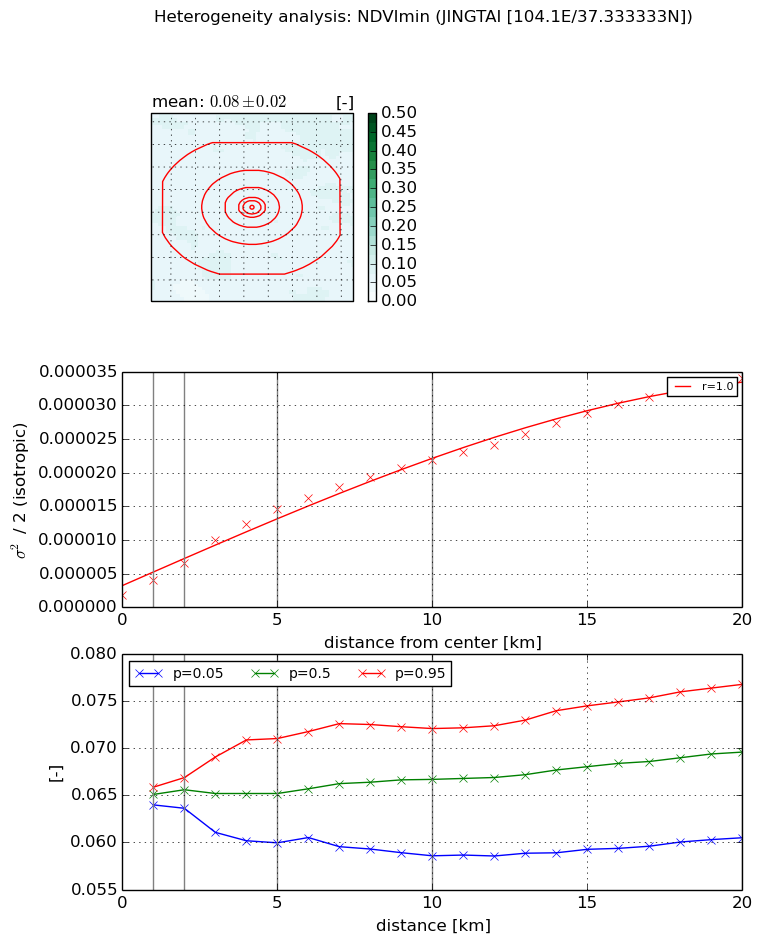
Heterogeneity analysis

The heterogeneity analysis provides information about the spatial and temporal heterogeneity of the site.

Topography


Roman et al. (2009) index


St

1.46089999497

Rcv

0.942083560187

Rse

0.0

Rst

-0.112195092133

Rsv

-0.999250001476


Height range @ 1km [m]

12

Height range @ 2km [m]

19

Height range @ 5km [m]

65

Height range @ 10km [m]

-999

Height range @ 20km [m]

-999


Variance slope @ 1 km

91

Variance slope @ 2 km

123

Variance slope @ 5 km

163

Variance slope @ 10 km

-999

Variance slope @ 20 km

-999


NDVI (max. NDVI composite)


Roman et al. (2009) index


St

3.75979600496

Rcv

0.283685266099

Rse

0.0

Rst

-0.0166179549411

Rsv

0.4976124095


NDVI range @ 1km [-]

0.02

NDVI range @ 2km [-]

0.15

NDVI range @ 5km [-]

0.28

NDVI range @ 10km [-]

0.27

NDVI range @ 20km [-]

0.33


Variance slope @ 1 km

0.000692230459328

Variance slope @ 2 km

0.000817653969748

Variance slope @ 5 km

0.00103275069153

Variance slope @ 10 km

0.000847300540381

Variance slope @ 20 km

0.000615504427672


NDVI (min. NDVI composite)I


Roman et al. (2009) index


St

3.88190217194e-07

Rcv

0.454566796415

Rse

0.0

Rst

0.245889227175

Rsv

7728169.32321


NDVI range @ 1km [-]

0.0

NDVI range @ 2km [-]

0.0

NDVI range @ 5km [-]

0.01

NDVI range @ 10km [-]

0.01

NDVI range @ 20km [-]

0.02


NDVI slope @ 1 km

2.15314730589e-06

NDVI slope @ 2 km

2.39662271879e-06

NDVI slope @ 5 km

2.64026343368e-06

NDVI slope @ 10 km

2.04473638777e-06

NDVI slope @ 20 km

1.5563008087e-06


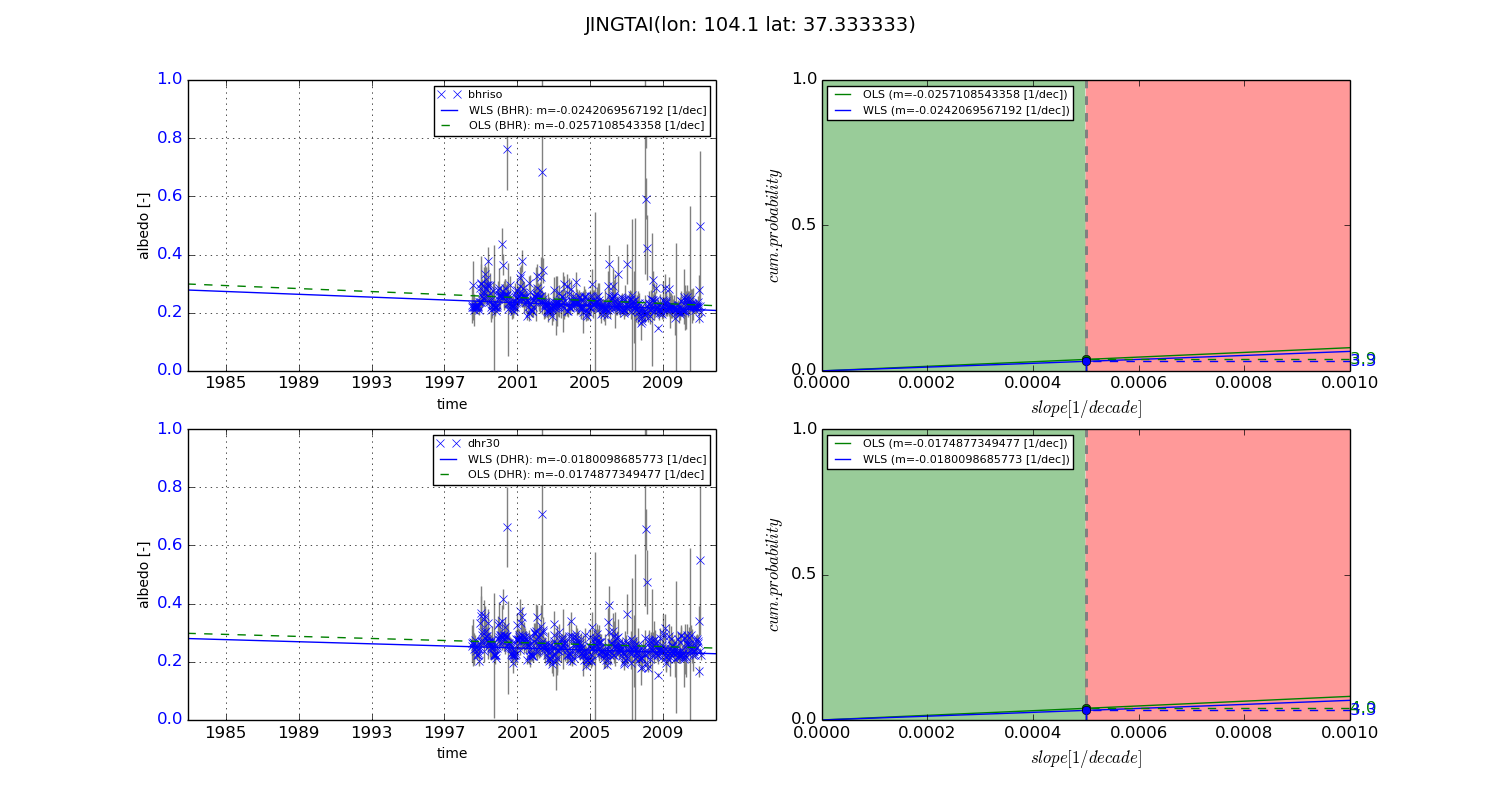
Temporal stability analysis

+000 deg (BHR)


BHR statistics

Temporal stability [1/decade]:


abs

rel


Weighted least square:

None


Ordinary least square:

None


Probabilities that GCOS criteria is met:

Weighted least square:

None %

Ordinary least square:

None %


DHR statistics

Temporal stability [1/decade]:


abs

rel


Weighted least square:

None


Ordinary least square:

None


Probabilities that GCOS criteria is met:

Weighted least square:

None %

Ordinary least square:

None %


+057/+063 deg (BHR)


BHR statistics

Temporal stability [1/decade]:


abs

rel


Weighted least square:

-0.0242069567192


Ordinary least square:

-0.0257108543358


Probabilities that GCOS criteria is met:

Weighted least square:

3.3 %

Ordinary least square:

3.9 %


DHR statistics

Temporal stability [1/decade]:


abs

rel


Weighted least square:

-0.0180098685773


Ordinary least square:

-0.0174877349477


Probabilities that GCOS criteria is met:

Weighted least square:

3.3 %

Ordinary least square:

4.0 %


Temporal anomaly analyis

The variance of the temporal anomalies provides an additional measure about the stability of the signal AFTER removal of the mean seasonal cylce.

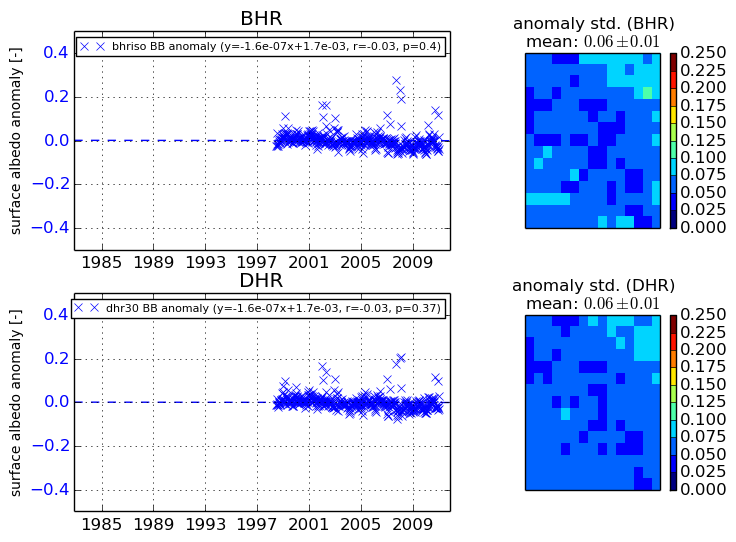
+000 deg


+057/+063 deg