JORNADA


Location

lon / lat [deg]: -106.5169 / 32.3511

Source network: AERONET


Geostationary surface albedo (GSA) data


“+000”


“+057/+063”


Landcover information (based on ESA CCI landcover data)


Landcover fractions @ 2km distance


Landcover fractions @ 20 km distance


Legend


Distance to open water bodies [km]:

28.19

Distance to urban areas [km]:

3.05


Radius: 1 km

Number of landcover classes:

3

Dominant landcover type:

120: Shrubland

Fraction of dominant landcover type [%]:

51.0


Radius: 2 km

Number of landcover classes:

3

Dominant landcover type:

120: Shrubland

Fraction of dominant landcover type [%]:

45.0


Radius: 5 km

Number of landcover classes:

4

Dominant landcover type:

130: grassland

Fraction of dominant landcover type [%]:

36.0


Radius: 10 km

Number of landcover classes:

4

Dominant landcover type:

120: Shrubland

Fraction of dominant landcover type [%]:

60.0


Radius: 20 km

Number of landcover classes:

4

Dominant landcover type:

120: Shrubland

Fraction of dominant landcover type [%]:

86.0


Disturbances


Heterogeneity analysis

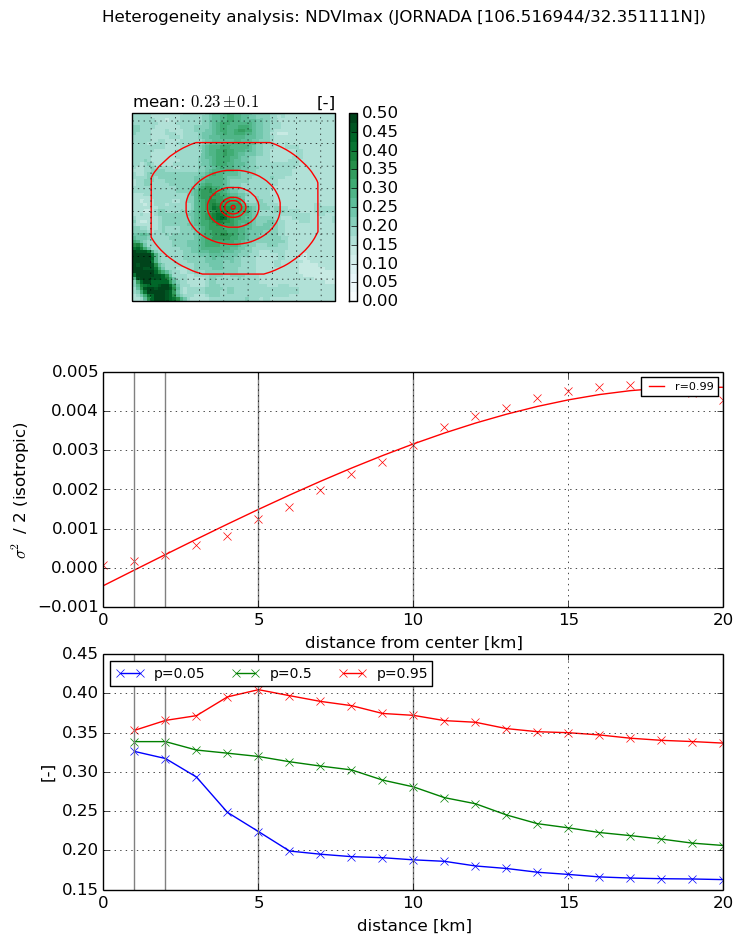
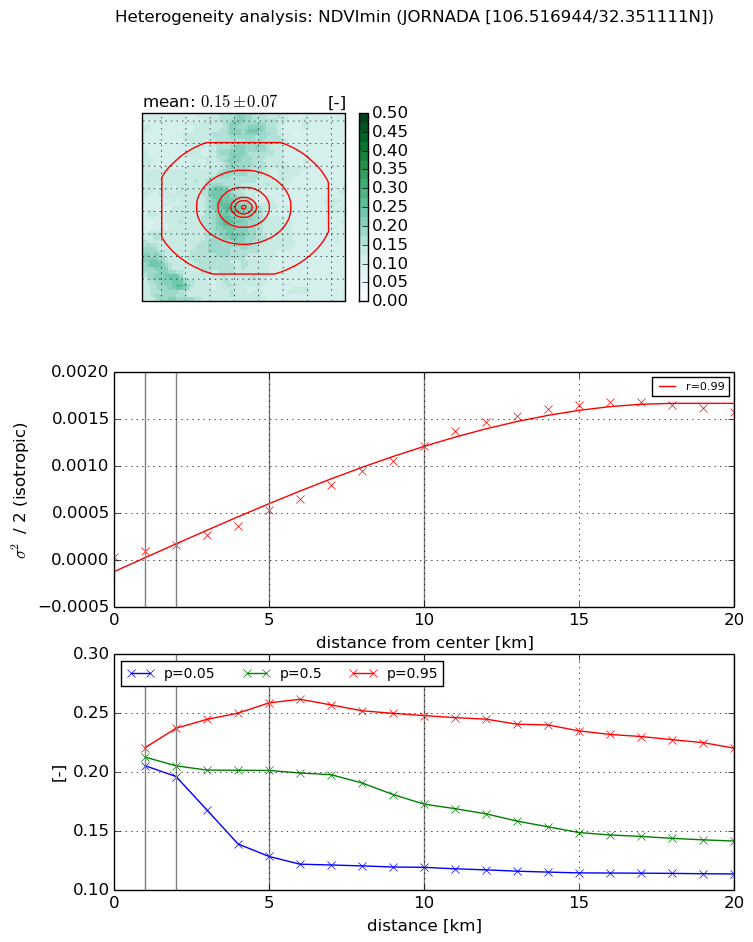
The heterogeneity analysis provides information about the spatial and temporal heterogeneity of the site.

Topography


Roman et al. (2009) index


St

4.63973399749

Rcv

0.137787209462

Rse

0.0

Rst

3.92541040013e-09

Rsv

0.508801578475


Height range @ 1km [m]

361

Height range @ 2km [m]

833

Height range @ 5km [m]

1125

Height range @ 10km [m]

-999

Height range @ 20km [m]

-999


Variance slope @ 1 km

14310

Variance slope @ 2 km

18518

Variance slope @ 5 km

28096

Variance slope @ 10 km

-999

Variance slope @ 20 km

-999


NDVI (max. NDVI composite)


Roman et al. (2009) index


St

nan

Rcv

nan

Rse

nan

Rst

nan

Rsv

nan


NDVI range @ 1km [-]

0.03

NDVI range @ 2km [-]

0.05

NDVI range @ 5km [-]

0.18

NDVI range @ 10km [-]

0.18

NDVI range @ 20km [-]

0.17


Variance slope @ 1 km

0.00011460462568

Variance slope @ 2 km

0.000130252382139

Variance slope @ 5 km

0.000232864638835

Variance slope @ 10 km

0.000320154861768

Variance slope @ 20 km

0.000264273089362


NDVI (min. NDVI composite)I


Roman et al. (2009) index


St

1.80283070044

Rcv

0.775380401988

Rse

0.0

Rst

-3.94882669427e-07

Rsv

-0.888668966238


NDVI range @ 1km [-]

0.02

NDVI range @ 2km [-]

0.04

NDVI range @ 5km [-]

0.13

NDVI range @ 10km [-]

0.13

NDVI range @ 20km [-]

0.11


NDVI slope @ 1 km

5.58346903595e-05

NDVI slope @ 2 km

6.15951467955e-05

NDVI slope @ 5 km

9.76294985558e-05

NDVI slope @ 10 km

0.000121744468094

NDVI slope @ 20 km

9.3222020913e-05


Temporal stability analysis

+000 deg (BHR)


BHR statistics

Temporal stability [1/decade]:


abs

rel


Weighted least square:

None


Ordinary least square:

None


Probabilities that GCOS criteria is met:

Weighted least square:

None %

Ordinary least square:

None %


DHR statistics

Temporal stability [1/decade]:


abs

rel


Weighted least square:

None


Ordinary least square:

None


Probabilities that GCOS criteria is met:

Weighted least square:

None %

Ordinary least square:

None %


+057/+063 deg (BHR)


BHR statistics

Temporal stability [1/decade]:


abs

rel


Weighted least square:

None


Ordinary least square:

None


Probabilities that GCOS criteria is met:

Weighted least square:

None %

Ordinary least square:

None %


DHR statistics

Temporal stability [1/decade]:


abs

rel


Weighted least square:

None


Ordinary least square:

None


Probabilities that GCOS criteria is met:

Weighted least square:

None %

Ordinary least square:

None %


Temporal anomaly analyis

The variance of the temporal anomalies provides an additional measure about the stability of the signal AFTER removal of the mean seasonal cylce.

+000 deg


+057/+063 deg