KARLSRUHE


Location

lon / lat [deg]: 8.4279 / 49.0933

Source network: AERONET


Geostationary surface albedo (GSA) data


“+000”


“+057/+063”


Landcover information (based on ESA CCI landcover data)


Landcover fractions @ 2km distance


Landcover fractions @ 20 km distance


Legend


Distance to open water bodies [km]:

2.79

Distance to urban areas [km]:

0.1


Radius: 1 km

Number of landcover classes:

5

Dominant landcover type:

190: urban areas

Fraction of dominant landcover type [%]:

75.0


Radius: 2 km

Number of landcover classes:

5

Dominant landcover type:

190: urban areas

Fraction of dominant landcover type [%]:

47.0


Radius: 5 km

Number of landcover classes:

7

Dominant landcover type:

190: urban areas

Fraction of dominant landcover type [%]:

37.0


Radius: 10 km

Number of landcover classes:

9

Dominant landcover type:

190: urban areas

Fraction of dominant landcover type [%]:

41.0


Radius: 20 km

Number of landcover classes:

6

Dominant landcover type:

190: urban areas

Fraction of dominant landcover type [%]:

36.0


Disturbances


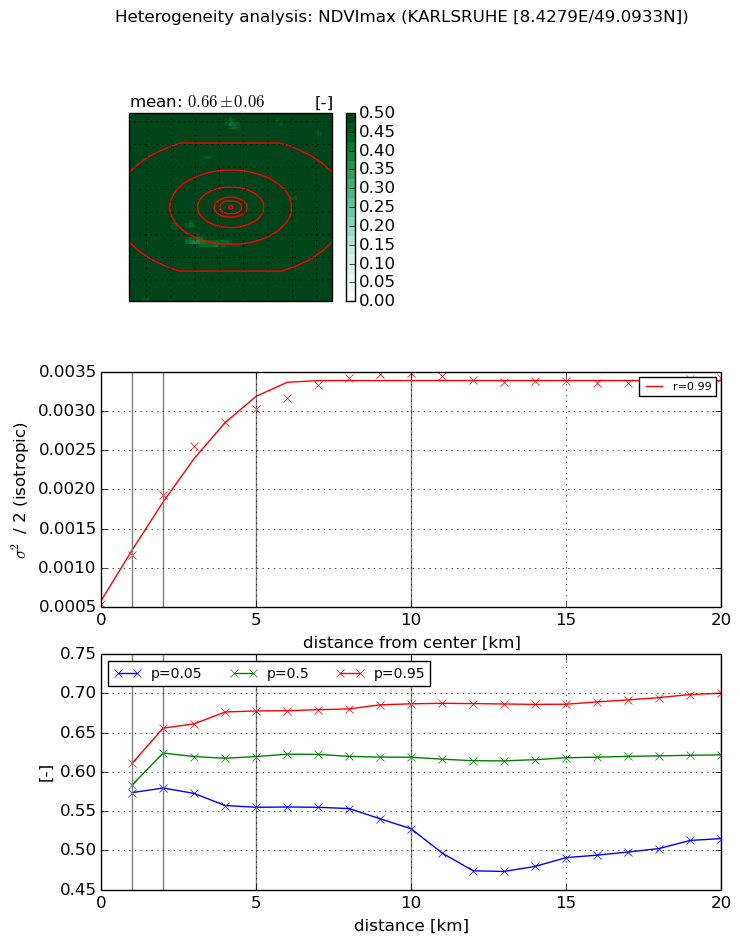
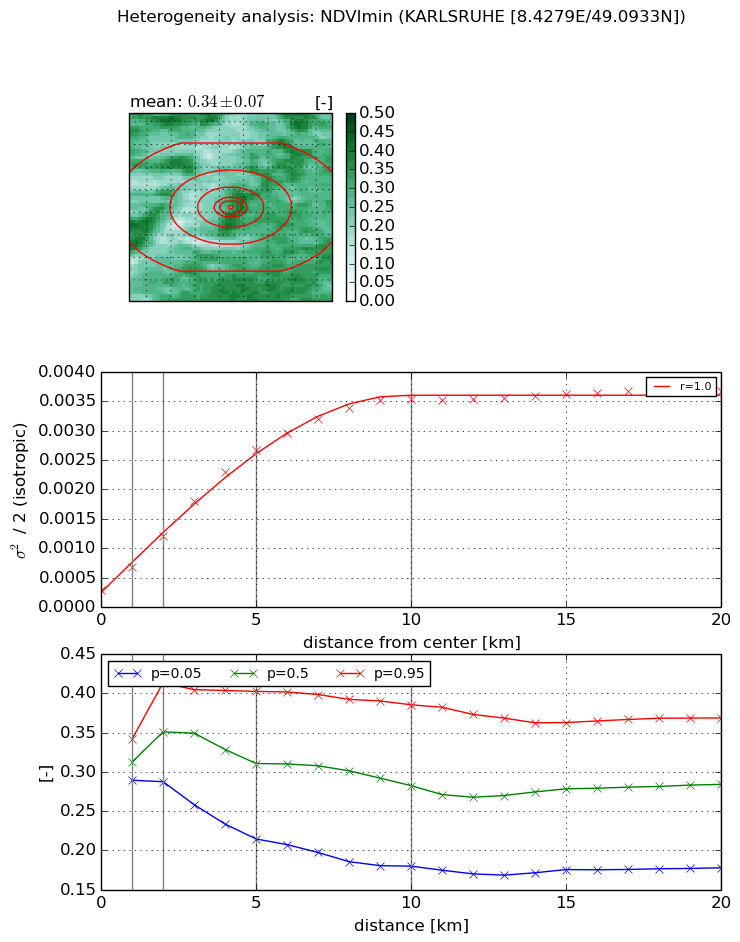
Heterogeneity analysis

The heterogeneity analysis provides information about the spatial and temporal heterogeneity of the site.

Topography


Roman et al. (2009) index


St

0.0122395817979

Rcv

0.10867901072

Rse

0.0

Rst

0.0161921955975

Rsv

244.98154252


Height range @ 1km [m]

14

Height range @ 2km [m]

17

Height range @ 5km [m]

25

Height range @ 10km [m]

-999

Height range @ 20km [m]

-999


Variance slope @ 1 km

17

Variance slope @ 2 km

13

Variance slope @ 5 km

13

Variance slope @ 10 km

-999

Variance slope @ 20 km

-999


NDVI (max. NDVI composite)


Roman et al. (2009) index


St

3.22376158647

Rcv

0.277147278205

Rse

0.0

Rst

0.342195554335

Rsv

-0.311247076029


NDVI range @ 1km [-]

0.04

NDVI range @ 2km [-]

0.08

NDVI range @ 5km [-]

0.12

NDVI range @ 10km [-]

0.16

NDVI range @ 20km [-]

0.19


Variance slope @ 1 km

0.000632788719615

Variance slope @ 2 km

0.000697154632345

Variance slope @ 5 km

0.000518935005508

Variance slope @ 10 km

0.000275842435012

Variance slope @ 20 km

9.3646459266e-05


NDVI (min. NDVI composite)I


Roman et al. (2009) index


St

5.01642517595

Rcv

0.317636647726

Rse

0.0

Rst

-0.0630517589139

Rsv

0.217347025918


NDVI range @ 1km [-]

0.05

NDVI range @ 2km [-]

0.13

NDVI range @ 5km [-]

0.19

NDVI range @ 10km [-]

0.21

NDVI range @ 20km [-]

0.19


NDVI slope @ 1 km

0.000384297344788

NDVI slope @ 2 km

0.000462120232029

NDVI slope @ 5 km

0.000495365077951

NDVI slope @ 10 km

0.000341287120239

NDVI slope @ 20 km

0.000143589389108


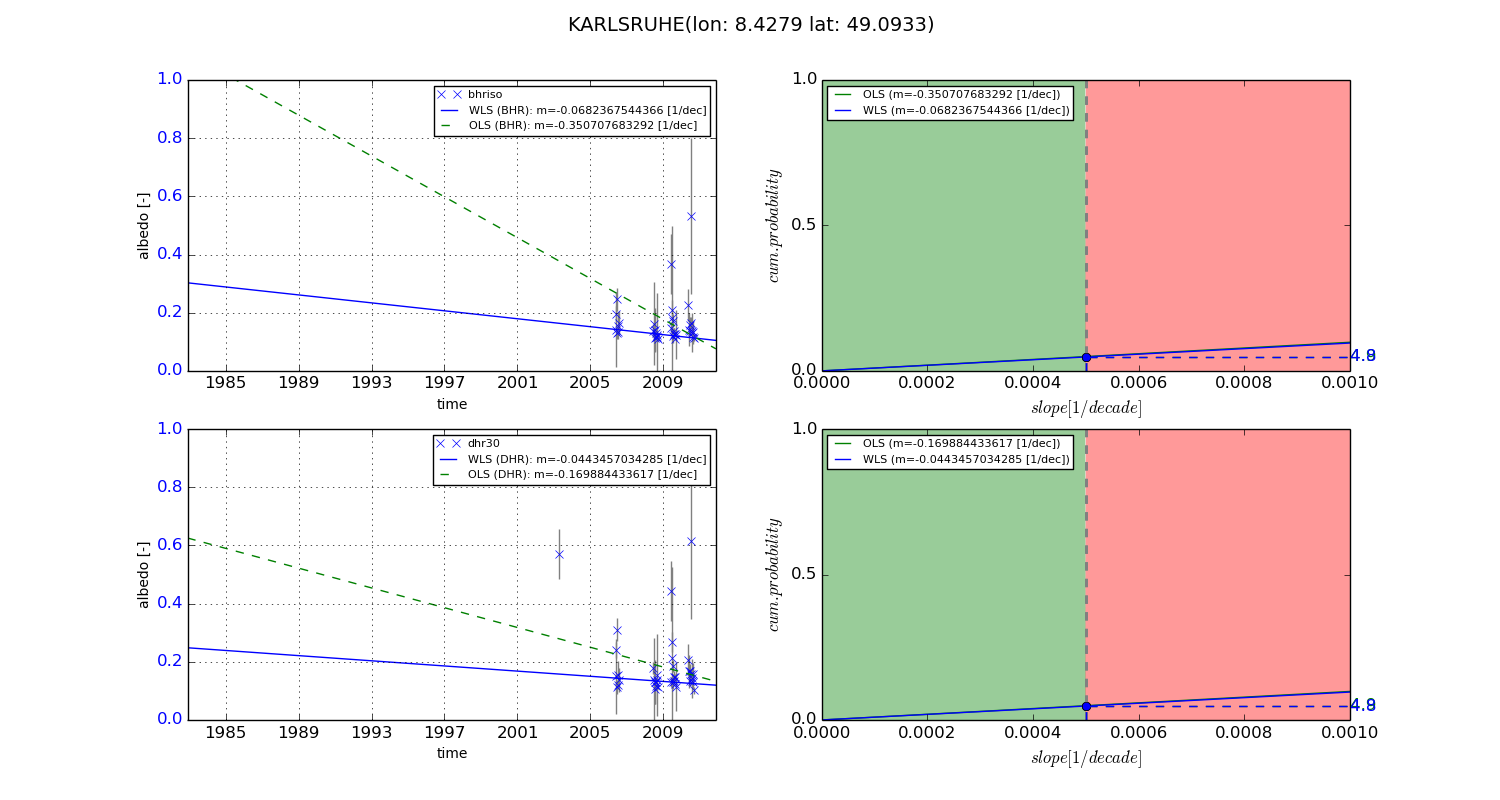
Temporal stability analysis

+000 deg (BHR)


BHR statistics

Temporal stability [1/decade]:


abs

rel


Weighted least square:

-0.0212613945643


Ordinary least square:

-0.0154407592634


Probabilities that GCOS criteria is met:

Weighted least square:

2.8 %

Ordinary least square:

3.7 %


DHR statistics

Temporal stability [1/decade]:


abs

rel


Weighted least square:

-0.0154237079292


Ordinary least square:

-0.0111344578962


Probabilities that GCOS criteria is met:

Weighted least square:

2.7 %

Ordinary least square:

3.7 %


+057/+063 deg (BHR)


BHR statistics

Temporal stability [1/decade]:


abs

rel


Weighted least square:

-0.0682367544366


Ordinary least square:

-0.350707683292


Probabilities that GCOS criteria is met:

Weighted least square:

4.8 %

Ordinary least square:

4.9 %


DHR statistics

Temporal stability [1/decade]:


abs

rel


Weighted least square:

-0.0443457034285


Ordinary least square:

-0.169884433617


Probabilities that GCOS criteria is met:

Weighted least square:

4.8 %

Ordinary least square:

4.9 %


Temporal anomaly analyis

The variance of the temporal anomalies provides an additional measure about the stability of the signal AFTER removal of the mean seasonal cylce.
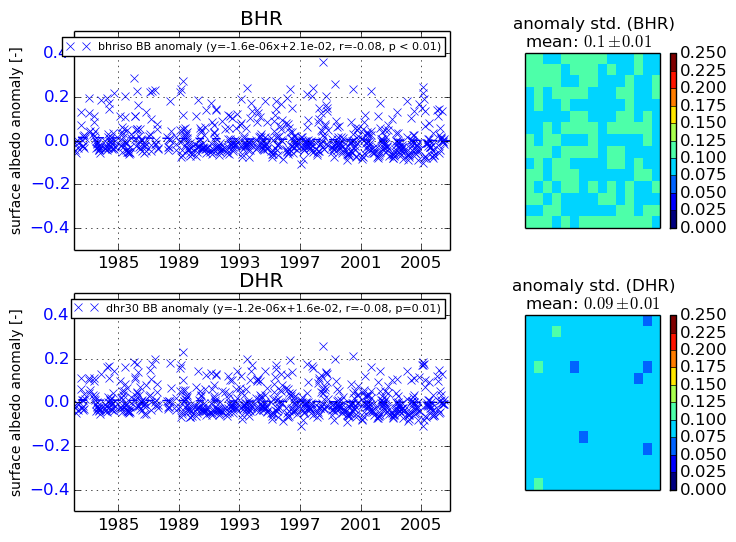
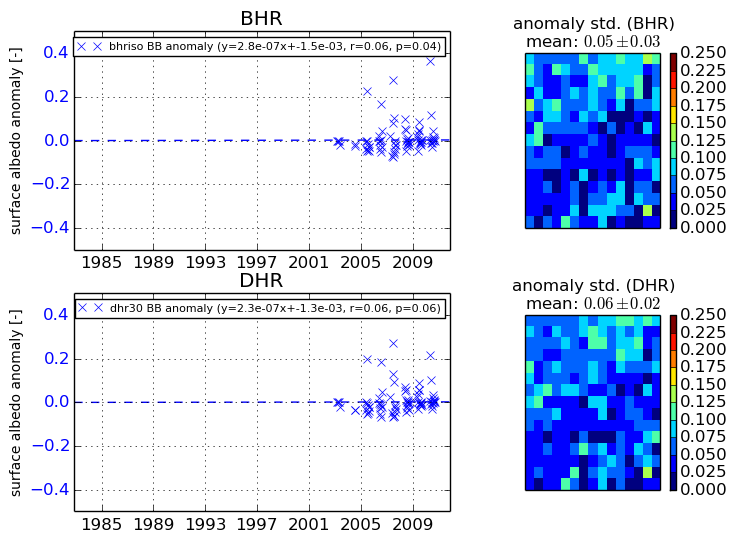
+000 deg


+057/+063 deg