KELOWNA


Location

lon / lat [deg]: -119.373 / 49.9553

Source network: AERONET


Geostationary surface albedo (GSA) data


“+000”


“+057/+063”


Landcover information (based on ESA CCI landcover data)


Landcover fractions @ 2km distance


Landcover fractions @ 20 km distance


Legend


Distance to open water bodies [km]:

3.3

Distance to urban areas [km]:

0.2


Radius: 1 km

Number of landcover classes:

3

Dominant landcover type:

190: urban areas

Fraction of dominant landcover type [%]:

45.0


Radius: 2 km

Number of landcover classes:

6

Dominant landcover type:

130: grassland

Fraction of dominant landcover type [%]:

42.0


Radius: 5 km

Number of landcover classes:

9

Dominant landcover type:

130: grassland

Fraction of dominant landcover type [%]:

34.0


Radius: 10 km

Number of landcover classes:

7

Dominant landcover type:

70: Tree cover, needleleaved, evergreen, closed to open (>15%)

Fraction of dominant landcover type [%]:

38.0


Radius: 20 km

Number of landcover classes:

6

Dominant landcover type:

70: Tree cover, needleleaved, evergreen, closed to open (>15%)

Fraction of dominant landcover type [%]:

59.0


Disturbances


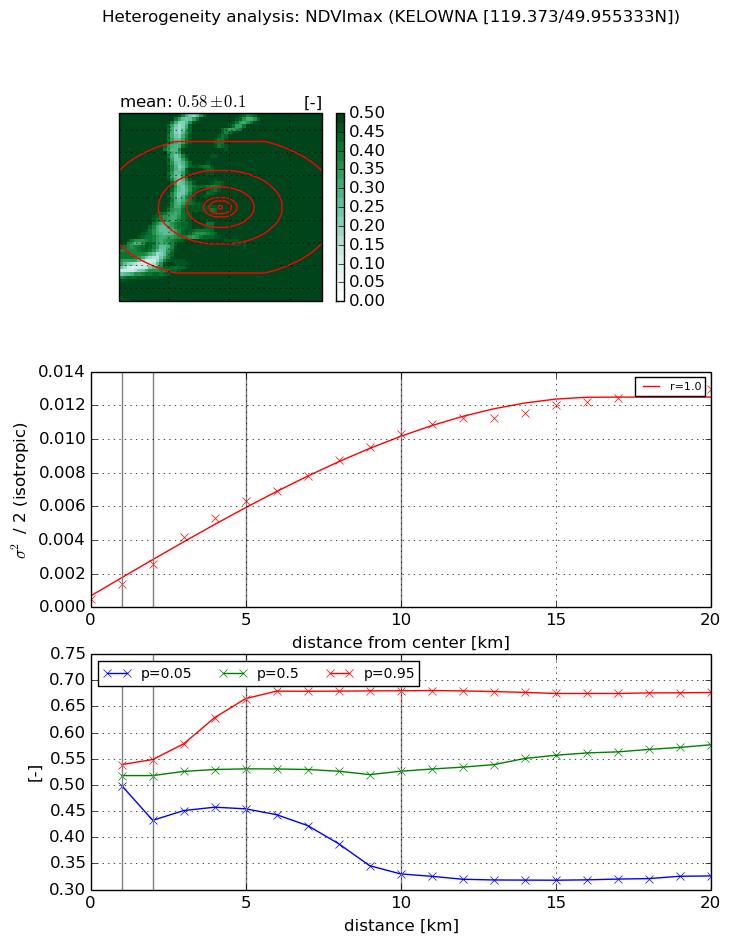
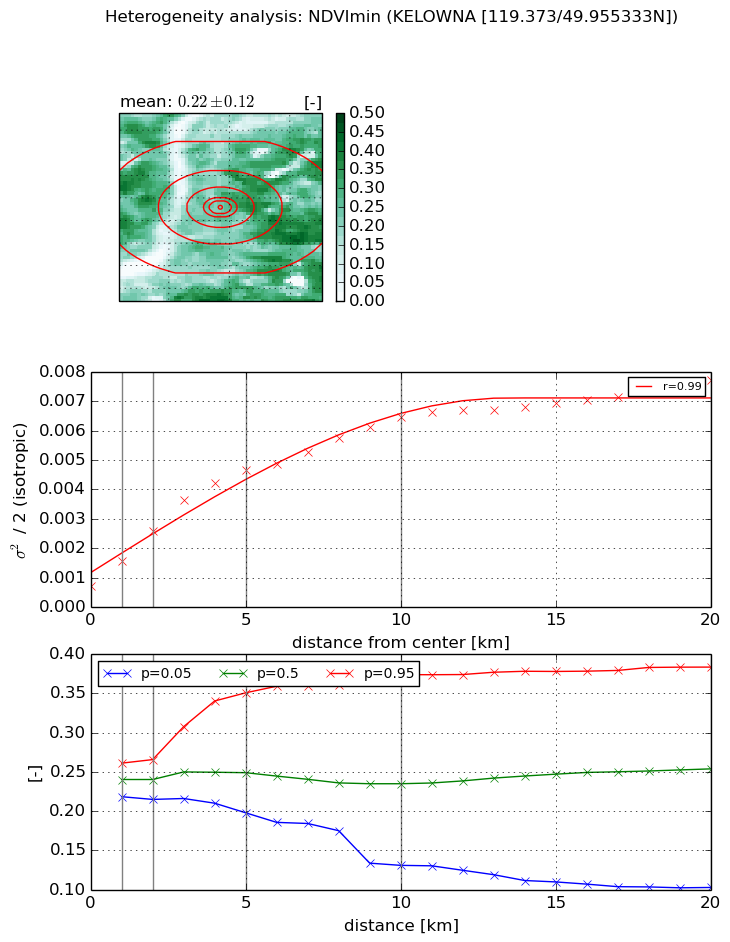
Heterogeneity analysis

The heterogeneity analysis provides information about the spatial and temporal heterogeneity of the site.

Topography


Roman et al. (2009) index


St

2.07830563609

Rcv

0.92418157934

Rse

0.0

Rst

1.00743402514e-08

Rsv

-0.519301961758


Height range @ 1km [m]

28

Height range @ 2km [m]

102

Height range @ 5km [m]

551

Height range @ 10km [m]

-999

Height range @ 20km [m]

-999


Variance slope @ 1 km

3794

Variance slope @ 2 km

5724

Variance slope @ 5 km

8873

Variance slope @ 10 km

-999

Variance slope @ 20 km

-999


NDVI (max. NDVI composite)


Roman et al. (2009) index


St

1.8080251432

Rcv

0.481059036051

Rse

0.0

Rst

-0.178210024864

Rsv

-0.999999899634


NDVI range @ 1km [-]

0.04

NDVI range @ 2km [-]

0.12

NDVI range @ 5km [-]

0.21

NDVI range @ 10km [-]

0.35

NDVI range @ 20km [-]

0.35


Variance slope @ 1 km

0.00090654616912

Variance slope @ 2 km

0.00106335344205

Variance slope @ 5 km

0.00122349264782

Variance slope @ 10 km

0.000993956969484

Variance slope @ 20 km

0.000614771873711


NDVI (min. NDVI composite)I


Roman et al. (2009) index


St

1.71153750284

Rcv

0.641697069344

Rse

0.0

Rst

-0.111113025147

Rsv

-0.999999876091


NDVI range @ 1km [-]

0.04

NDVI range @ 2km [-]

0.05

NDVI range @ 5km [-]

0.15

NDVI range @ 10km [-]

0.24

NDVI range @ 20km [-]

0.28


NDVI slope @ 1 km

0.000856873566052

NDVI slope @ 2 km

0.000943442206107

NDVI slope @ 5 km

0.000820604286677

NDVI slope @ 10 km

0.000549013042143

NDVI slope @ 20 km

0.000298694148967


Temporal stability analysis

+000 deg (BHR)


BHR statistics

Temporal stability [1/decade]:


abs

rel


Weighted least square:

None


Ordinary least square:

None


Probabilities that GCOS criteria is met:

Weighted least square:

None %

Ordinary least square:

None %


DHR statistics

Temporal stability [1/decade]:


abs

rel


Weighted least square:

None


Ordinary least square:

None


Probabilities that GCOS criteria is met:

Weighted least square:

None %

Ordinary least square:

None %


+057/+063 deg (BHR)


BHR statistics

Temporal stability [1/decade]:


abs

rel


Weighted least square:

None


Ordinary least square:

None


Probabilities that GCOS criteria is met:

Weighted least square:

None %

Ordinary least square:

None %


DHR statistics

Temporal stability [1/decade]:


abs

rel


Weighted least square:

None


Ordinary least square:

None


Probabilities that GCOS criteria is met:

Weighted least square:

None %

Ordinary least square:

None %


Temporal anomaly analyis

The variance of the temporal anomalies provides an additional measure about the stability of the signal AFTER removal of the mean seasonal cylce.

+000 deg


+057/+063 deg