KHAUDUM


Location

lon / lat [deg]: 20.575 / -19.024

Source network: ALBEDOVAL2


Geostationary surface albedo (GSA) data


“+000”


“+057/+063”


Landcover information (based on ESA CCI landcover data)


Landcover fractions @ 2km distance


Landcover fractions @ 20 km distance


Legend


Distance to open water bodies [km]:

none in region

Distance to urban areas [km]:

none in region


Radius: 1 km

Number of landcover classes:

1

Dominant landcover type:

130: grassland

Fraction of dominant landcover type [%]:

100.0


Radius: 2 km

Number of landcover classes:

2

Dominant landcover type:

130: grassland

Fraction of dominant landcover type [%]:

96.0


Radius: 5 km

Number of landcover classes:

4

Dominant landcover type:

130: grassland

Fraction of dominant landcover type [%]:

84.0


Radius: 10 km

Number of landcover classes:

3

Dominant landcover type:

130: grassland

Fraction of dominant landcover type [%]:

90.0


Radius: 20 km

Number of landcover classes:

3

Dominant landcover type:

130: grassland

Fraction of dominant landcover type [%]:

90.0


Disturbances


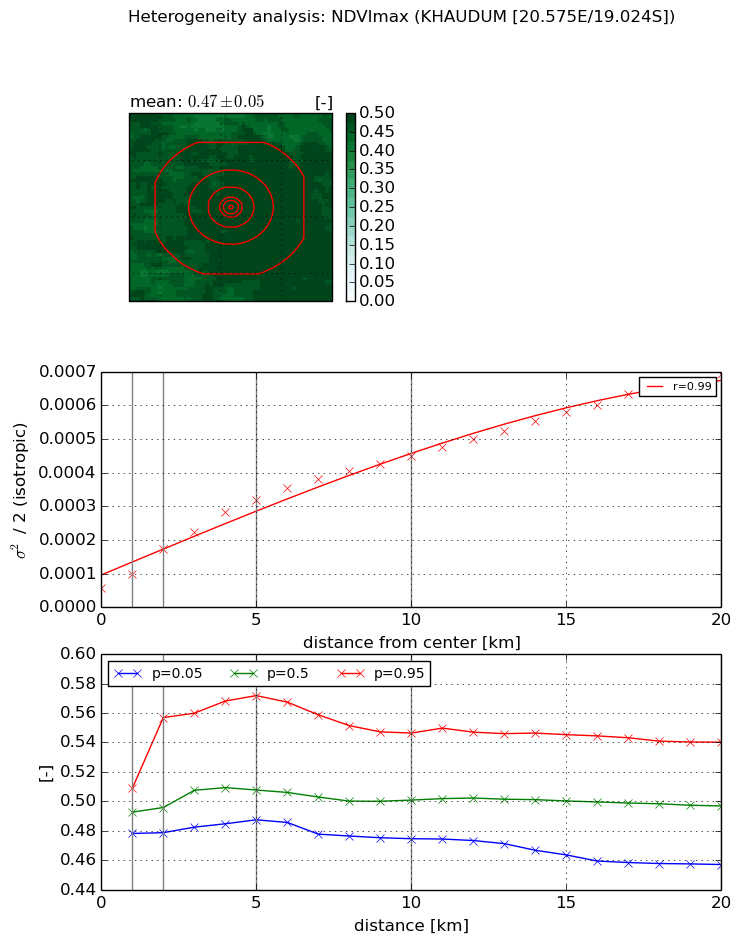
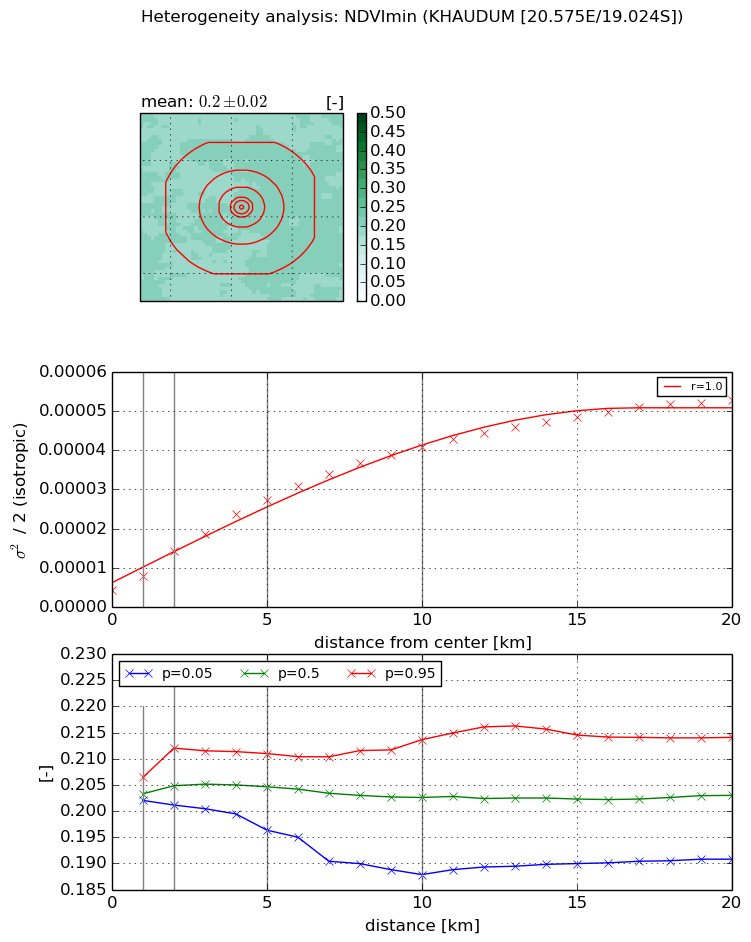
Heterogeneity analysis

The heterogeneity analysis provides information about the spatial and temporal heterogeneity of the site.

Topography


Roman et al. (2009) index


St

3.93247189291

Rcv

0.317677402867

Rse

0.0

Rst

-0.0564832438324

Rsv

0.388718296035


Height range @ 1km [m]

9

Height range @ 2km [m]

10

Height range @ 5km [m]

13

Height range @ 10km [m]

-999

Height range @ 20km [m]

-999


Variance slope @ 1 km

6

Variance slope @ 2 km

6

Variance slope @ 5 km

3

Variance slope @ 10 km

-999

Variance slope @ 20 km

-999


NDVI (max. NDVI composite)


Roman et al. (2009) index


St

11.5218926456

Rcv

-0.0501857295023

Rse

0.0

Rst

-0.0065692376918

Rsv

0.203618922085


NDVI range @ 1km [-]

0.03

NDVI range @ 2km [-]

0.08

NDVI range @ 5km [-]

0.08

NDVI range @ 10km [-]

0.07

NDVI range @ 20km [-]

0.08


Variance slope @ 1 km

4.09328642735e-05

Variance slope @ 2 km

5.76158234048e-05

Variance slope @ 5 km

5.48867114124e-05

Variance slope @ 10 km

3.95958629666e-05

Variance slope @ 20 km

2.97641030592e-05


NDVI (min. NDVI composite)I


Roman et al. (2009) index


St

4.97772279254e-05

Rcv

0.0943915100254

Rse

0.0

Rst

0.132930545241

Rsv

60268.2955554


NDVI range @ 1km [-]

0.0

NDVI range @ 2km [-]

0.01

NDVI range @ 5km [-]

0.01

NDVI range @ 10km [-]

0.03

NDVI range @ 20km [-]

0.02


NDVI slope @ 1 km

3.49930836964e-06

NDVI slope @ 2 km

4.90434960742e-06

NDVI slope @ 5 km

4.75479180643e-06

NDVI slope @ 10 km

3.744970458e-06

NDVI slope @ 20 km

2.32684314076e-06


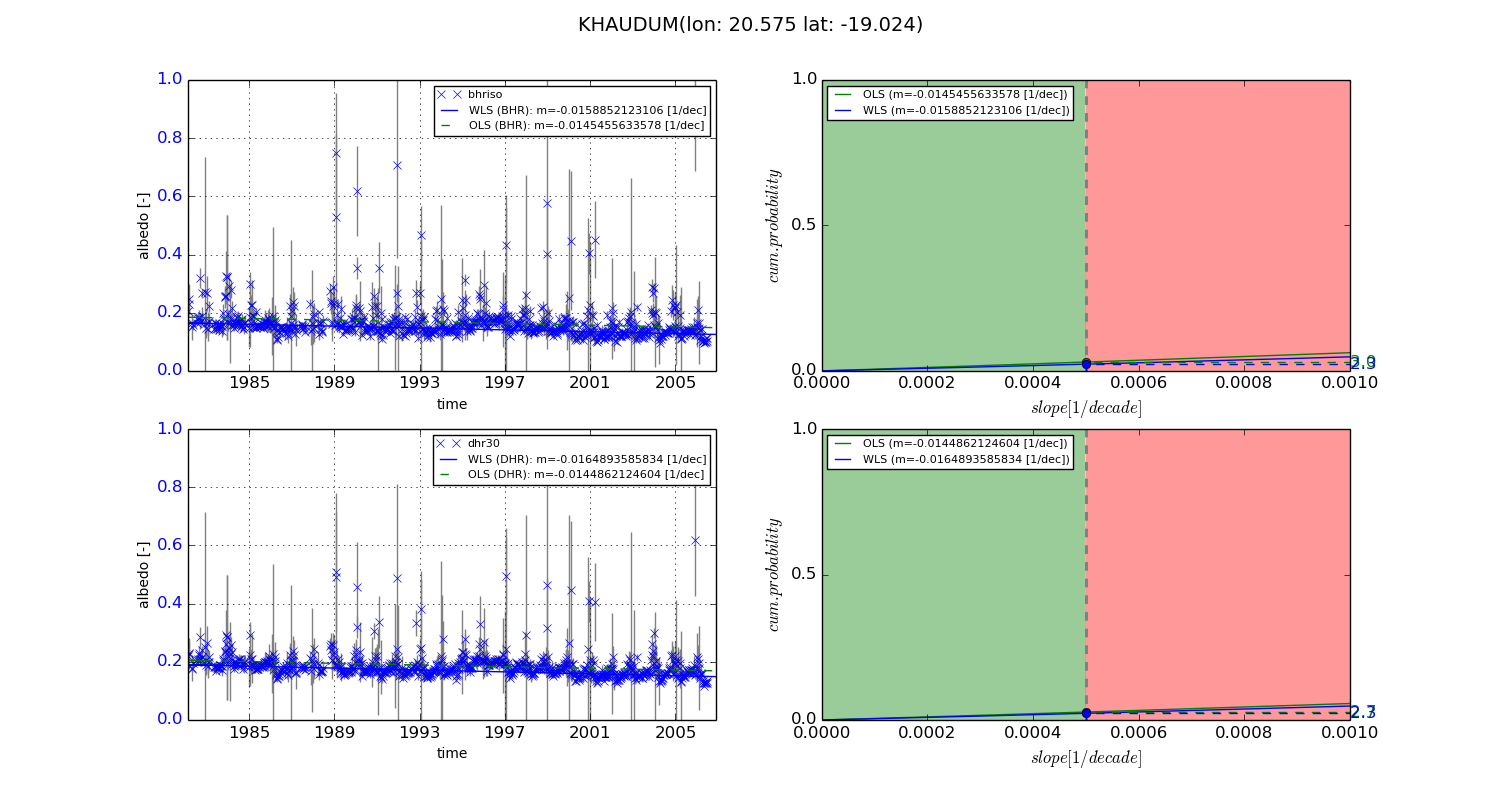
Temporal stability analysis

+000 deg (BHR)


BHR statistics

Temporal stability [1/decade]:


abs

rel


Weighted least square:

-0.0158852123106


Ordinary least square:

-0.0145455633578


Probabilities that GCOS criteria is met:

Weighted least square:

2.3 %

Ordinary least square:

3.0 %


DHR statistics

Temporal stability [1/decade]:


abs

rel


Weighted least square:

-0.0164893585834


Ordinary least square:

-0.0144862124604


Probabilities that GCOS criteria is met:

Weighted least square:

2.3 %

Ordinary least square:

2.7 %


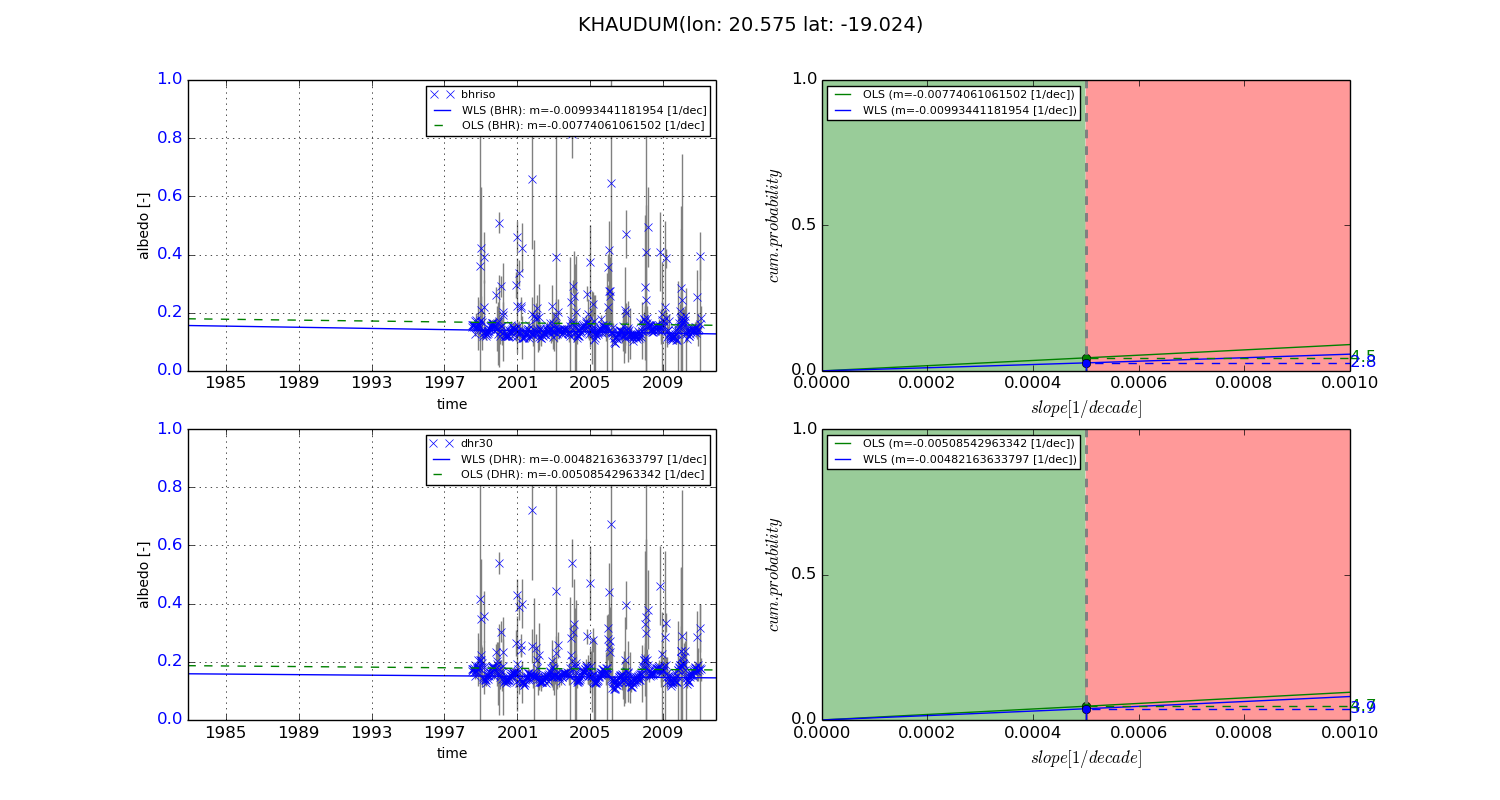
+057/+063 deg (BHR)


BHR statistics

Temporal stability [1/decade]:


abs

rel


Weighted least square:

-0.00993441181954


Ordinary least square:

-0.00774061061502


Probabilities that GCOS criteria is met:

Weighted least square:

2.8 %

Ordinary least square:

4.5 %


DHR statistics

Temporal stability [1/decade]:


abs

rel


Weighted least square:

-0.00482163633797


Ordinary least square:

-0.00508542963342


Probabilities that GCOS criteria is met:

Weighted least square:

3.9 %

Ordinary least square:

4.7 %


Temporal anomaly analyis

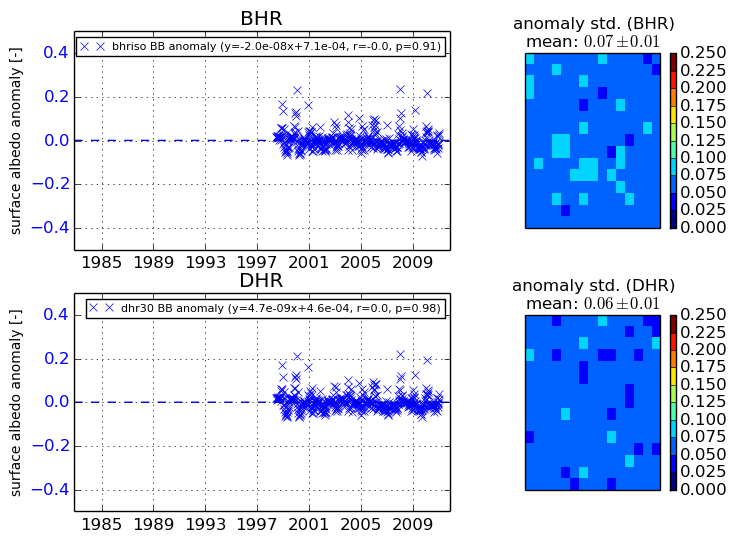
The variance of the temporal anomalies provides an additional measure about the stability of the signal AFTER removal of the mean seasonal cylce.
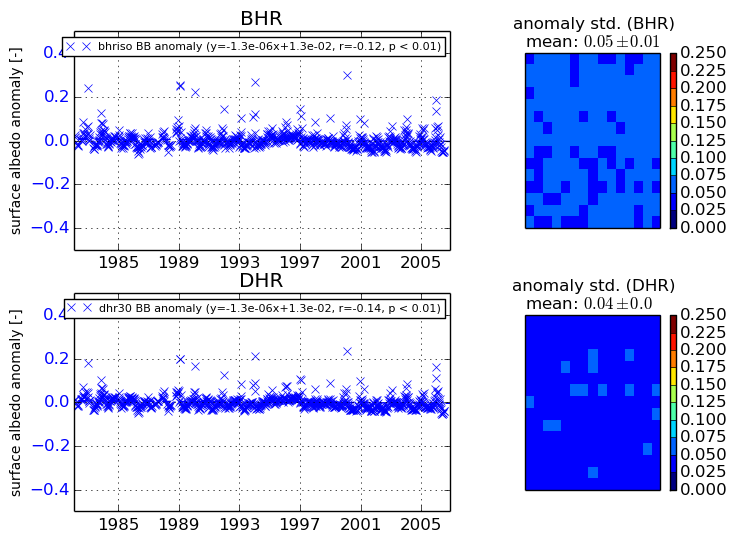
+000 deg


+057/+063 deg