KR-KW1


Location

lon / lat [deg]: 127.163 / 37.7486

Source network: FLUXNET


Geostationary surface albedo (GSA) data


“+000”


“+057/+063”


Landcover information (based on ESA CCI landcover data)


Landcover fractions @ 2km distance


Landcover fractions @ 20 km distance


Legend


Distance to open water bodies [km]:

5.58

Distance to urban areas [km]:

2.74


Radius: 1 km

Number of landcover classes:

1

Dominant landcover type:

70: Tree cover, needleleaved, evergreen, closed to open (>15%)

Fraction of dominant landcover type [%]:

100.0


Radius: 2 km

Number of landcover classes:

4

Dominant landcover type:

70: Tree cover, needleleaved, evergreen, closed to open (>15%)

Fraction of dominant landcover type [%]:

87.0


Radius: 5 km

Number of landcover classes:

9

Dominant landcover type:

70: Tree cover, needleleaved, evergreen, closed to open (>15%)

Fraction of dominant landcover type [%]:

55.0


Radius: 10 km

Number of landcover classes:

9

Dominant landcover type:

70: Tree cover, needleleaved, evergreen, closed to open (>15%)

Fraction of dominant landcover type [%]:

40.0


Radius: 20 km

Number of landcover classes:

9

Dominant landcover type:

70: Tree cover, needleleaved, evergreen, closed to open (>15%)

Fraction of dominant landcover type [%]:

38.0


Disturbances


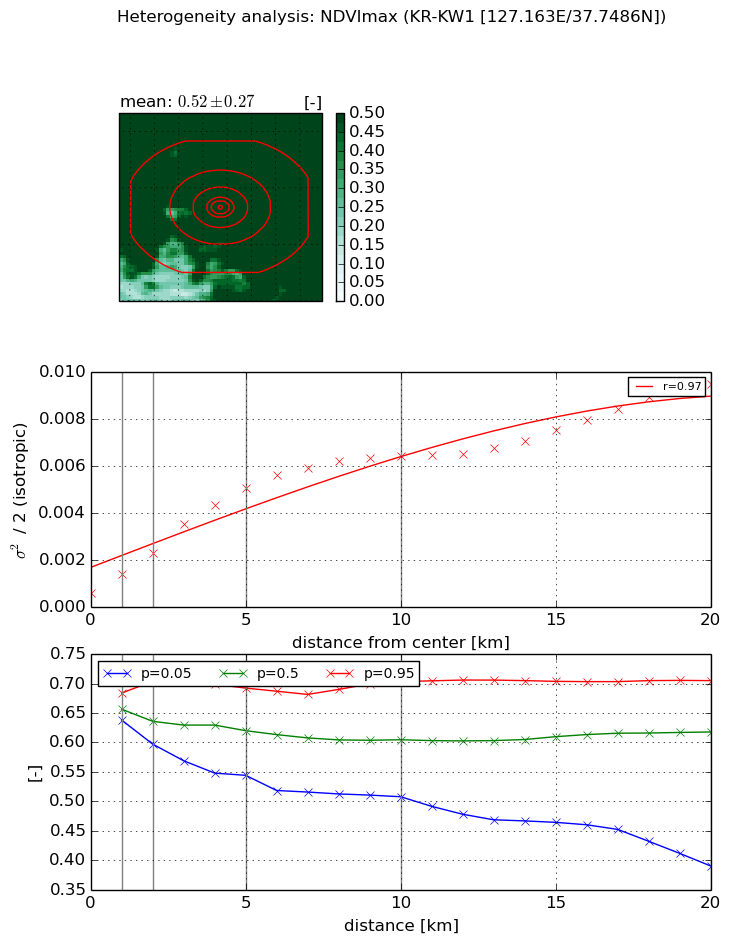
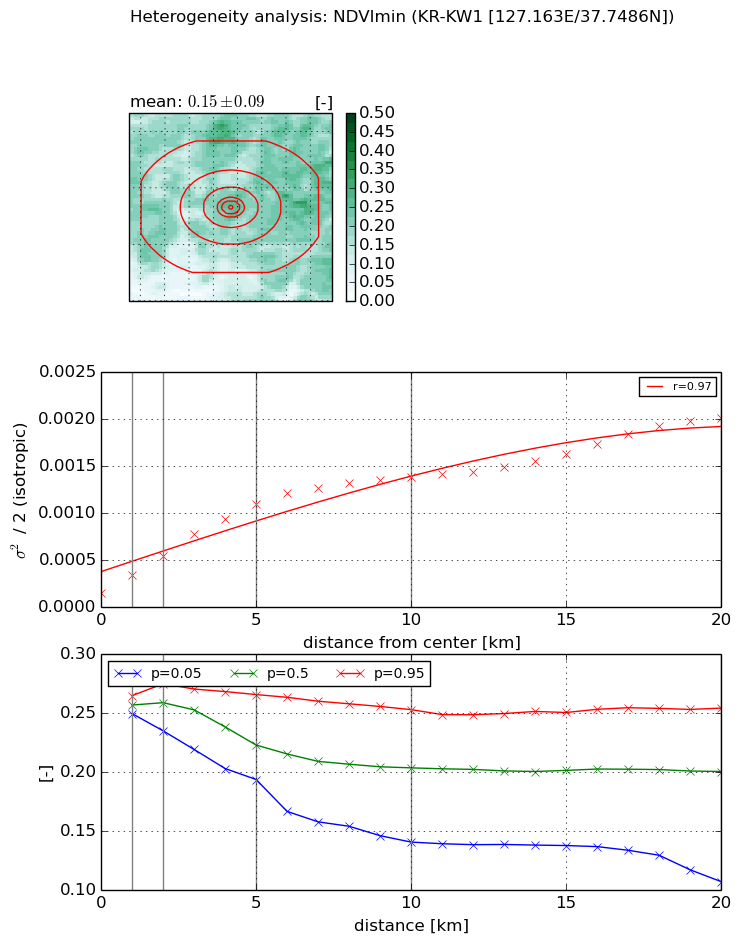
Heterogeneity analysis

The heterogeneity analysis provides information about the spatial and temporal heterogeneity of the site.

Topography


Roman et al. (2009) index


St

10.7951845413

Rcv

0.240033258534

Rse

0.0

Rst

0.0281882039755

Rsv

0.00968022490692


Height range @ 1km [m]

162

Height range @ 2km [m]

301

Height range @ 5km [m]

301

Height range @ 10km [m]

-999

Height range @ 20km [m]

-999


Variance slope @ 1 km

4087

Variance slope @ 2 km

3565

Variance slope @ 5 km

1891

Variance slope @ 10 km

-999

Variance slope @ 20 km

-999


NDVI (max. NDVI composite)


Roman et al. (2009) index


St

18.9408965393

Rcv

0.102710311666

Rse

0.0

Rst

-0.0423729523426

Rsv

0.0133041699634


NDVI range @ 1km [-]

0.05

NDVI range @ 2km [-]

0.11

NDVI range @ 5km [-]

0.15

NDVI range @ 10km [-]

0.2

NDVI range @ 20km [-]

0.32


Variance slope @ 1 km

0.000806889386103

Variance slope @ 2 km

0.000857382194537

Variance slope @ 5 km

0.000922976081885

Variance slope @ 10 km

0.000603571783145

Variance slope @ 20 km

0.000376074666298


NDVI (min. NDVI composite)I


Roman et al. (2009) index


St

2.30734331905

Rcv

0.731262691914

Rse

0.0

Rst

-0.242478406053

Rsv

0.326455528704


NDVI range @ 1km [-]

0.02

NDVI range @ 2km [-]

0.04

NDVI range @ 5km [-]

0.07

NDVI range @ 10km [-]

0.11

NDVI range @ 20km [-]

0.15


NDVI slope @ 1 km

0.000186605355603

NDVI slope @ 2 km

0.000192325259516

NDVI slope @ 5 km

0.000192734426051

NDVI slope @ 10 km

0.000125293870119

NDVI slope @ 20 km

7.98658565582e-05


Temporal stability analysis

+000 deg (BHR)


BHR statistics

Temporal stability [1/decade]:


abs

rel


Weighted least square:

None


Ordinary least square:

None


Probabilities that GCOS criteria is met:

Weighted least square:

None %

Ordinary least square:

None %


DHR statistics

Temporal stability [1/decade]:


abs

rel


Weighted least square:

None


Ordinary least square:

None


Probabilities that GCOS criteria is met:

Weighted least square:

None %

Ordinary least square:

None %


+057/+063 deg (BHR)


BHR statistics

Temporal stability [1/decade]:


abs

rel


Weighted least square:

-99999.0


Ordinary least square:

-99999.0


Probabilities that GCOS criteria is met:

Weighted least square:

-99999.0 %

Ordinary least square:

-99999.0 %


DHR statistics

Temporal stability [1/decade]:


abs

rel


Weighted least square:

-99999.0


Ordinary least square:

-99999.0


Probabilities that GCOS criteria is met:

Weighted least square:

-99999.0 %

Ordinary least square:

-99999.0 %


Temporal anomaly analyis

The variance of the temporal anomalies provides an additional measure about the stability of the signal AFTER removal of the mean seasonal cylce.

+000 deg


+057/+063 deg