KRASNOYARSK


Location

lon / lat [deg]: 92.7667 / 55.9833

Source network: AERONET


Geostationary surface albedo (GSA) data


“+000”


“+057/+063”


Landcover information (based on ESA CCI landcover data)


Landcover fractions @ 2km distance


Landcover fractions @ 20 km distance


Legend


Distance to open water bodies [km]:

0.18

Distance to urban areas [km]:

0.3


Radius: 1 km

Number of landcover classes:

4

Dominant landcover type:

190: urban areas

Fraction of dominant landcover type [%]:

57.0


Radius: 2 km

Number of landcover classes:

5

Dominant landcover type:

190: urban areas

Fraction of dominant landcover type [%]:

43.0


Radius: 5 km

Number of landcover classes:

7

Dominant landcover type:

190: urban areas

Fraction of dominant landcover type [%]:

38.0


Radius: 10 km

Number of landcover classes:

7

Dominant landcover type:

190: urban areas

Fraction of dominant landcover type [%]:

36.0


Radius: 20 km

Number of landcover classes:

7

Dominant landcover type:

70: Tree cover, needleleaved, evergreen, closed to open (>15%)

Fraction of dominant landcover type [%]:

32.0


Disturbances


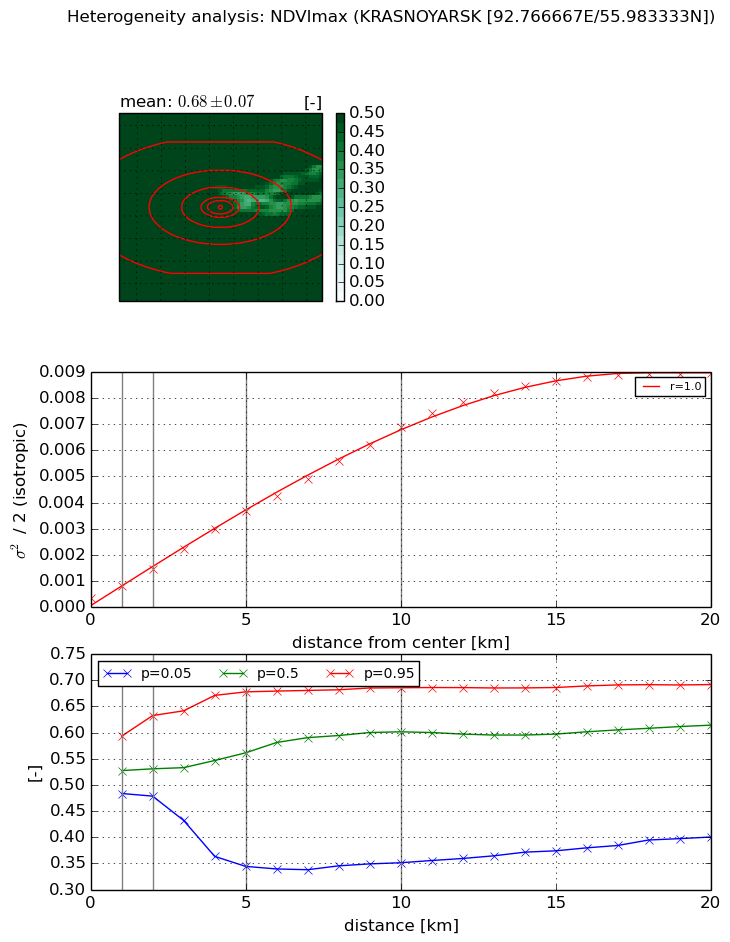
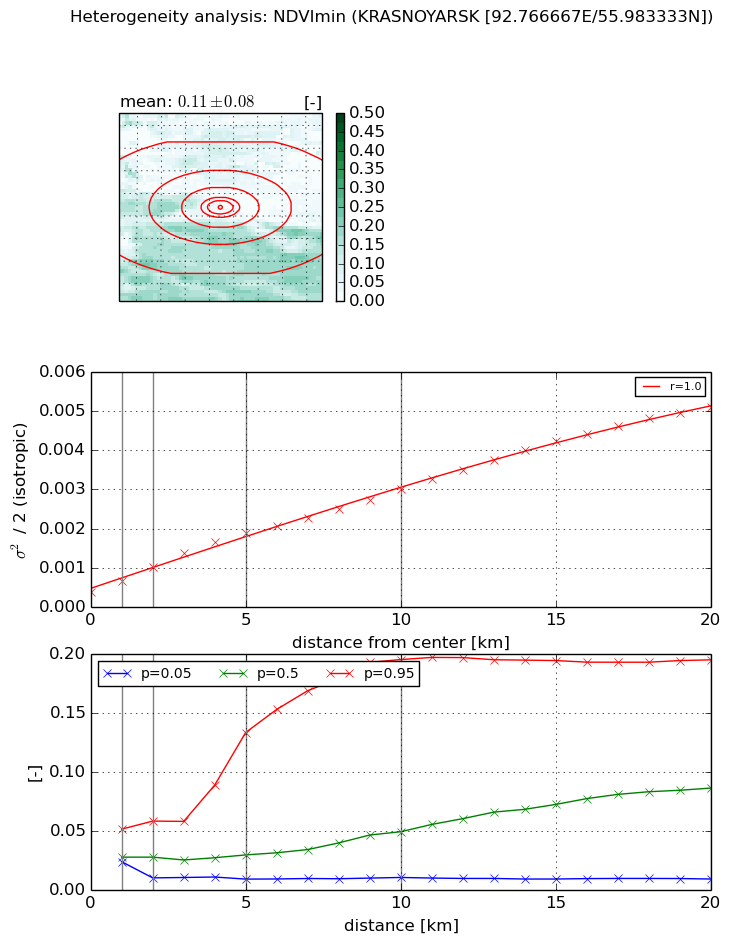
Heterogeneity analysis

The heterogeneity analysis provides information about the spatial and temporal heterogeneity of the site.

Topography


Roman et al. (2009) index


St

5.70991035358

Rcv

0.128213963802

Rse

0.0

Rst

-0.023524930181

Rsv

0.373663400313


Height range @ 1km [m]

133

Height range @ 2km [m]

177

Height range @ 5km [m]

326

Height range @ 10km [m]

-999

Height range @ 20km [m]

-999


Variance slope @ 1 km

3210

Variance slope @ 2 km

3382

Variance slope @ 5 km

3099

Variance slope @ 10 km

-999

Variance slope @ 20 km

-999


NDVI (max. NDVI composite)


Roman et al. (2009) index


St

1.83192145695

Rcv

0.523600522015

Rse

0.0

Rst

0.0400687252011

Rsv

1.07395554757


NDVI range @ 1km [-]

0.11

NDVI range @ 2km [-]

0.15

NDVI range @ 5km [-]

0.33

NDVI range @ 10km [-]

0.33

NDVI range @ 20km [-]

0.29


Variance slope @ 1 km

0.000433600247855

Variance slope @ 2 km

0.000546490429814

Variance slope @ 5 km

0.000684384345519

Variance slope @ 10 km

0.000665659310625

Variance slope @ 20 km

0.000465046716371


NDVI (min. NDVI composite)I


Roman et al. (2009) index


St

1.40694550604

Rcv

0.780015724895

Rse

0.0

Rst

-0.352280917101

Rsv

-0.999982104501


NDVI range @ 1km [-]

0.03

NDVI range @ 2km [-]

0.05

NDVI range @ 5km [-]

0.12

NDVI range @ 10km [-]

0.19

NDVI range @ 20km [-]

0.19


NDVI slope @ 1 km

0.000286675375607

NDVI slope @ 2 km

0.000316855026822

NDVI slope @ 5 km

0.000308067557427

NDVI slope @ 10 km

0.000254717007947

NDVI slope @ 20 km

0.000235528369309


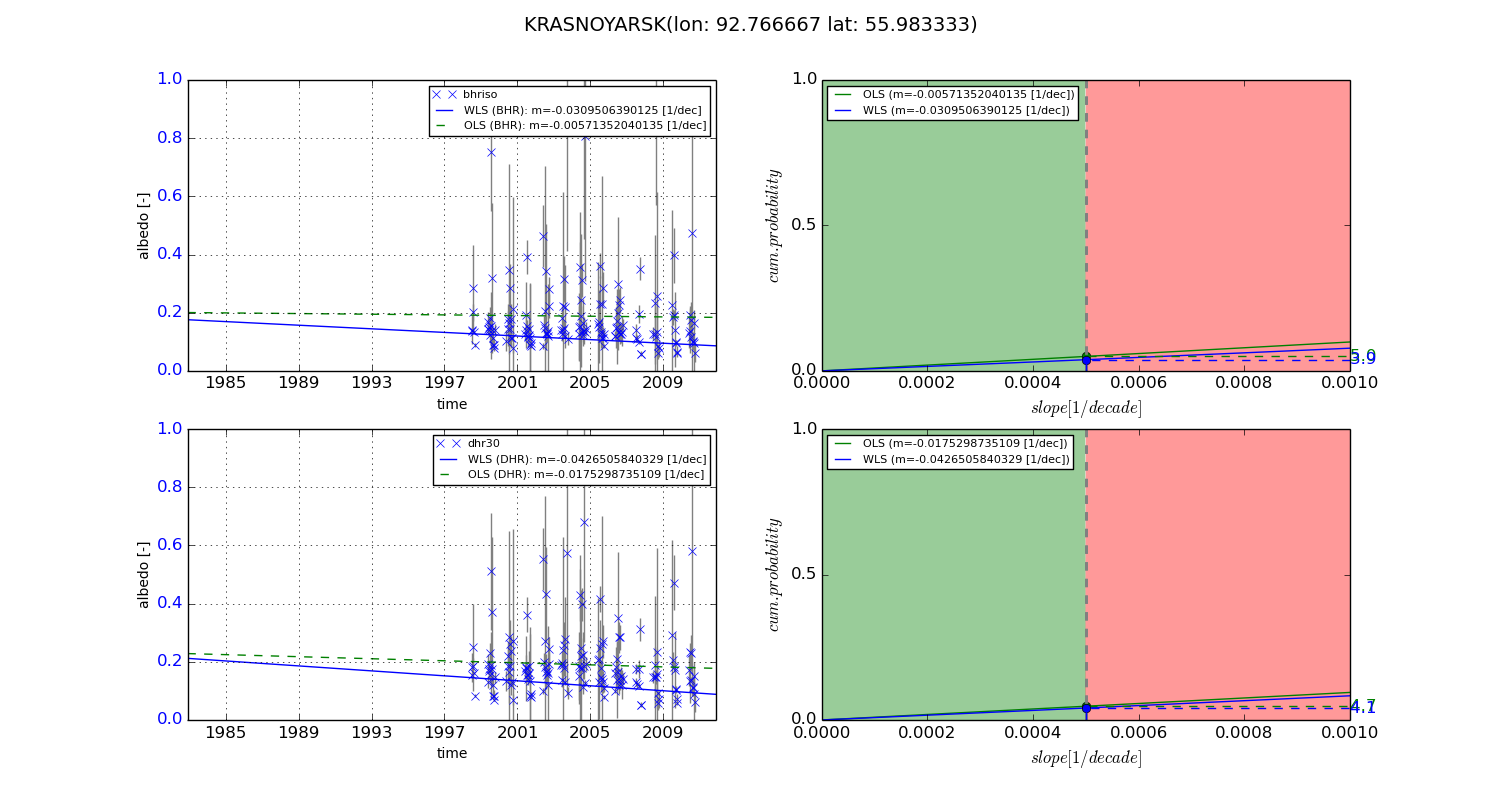
Temporal stability analysis

+000 deg (BHR)


BHR statistics

Temporal stability [1/decade]:


abs

rel


Weighted least square:

None


Ordinary least square:

None


Probabilities that GCOS criteria is met:

Weighted least square:

None %

Ordinary least square:

None %


DHR statistics

Temporal stability [1/decade]:


abs

rel


Weighted least square:

None


Ordinary least square:

None


Probabilities that GCOS criteria is met:

Weighted least square:

None %

Ordinary least square:

None %


+057/+063 deg (BHR)


BHR statistics

Temporal stability [1/decade]:


abs

rel


Weighted least square:

-0.0309506390125


Ordinary least square:

-0.00571352040135


Probabilities that GCOS criteria is met:

Weighted least square:

3.9 %

Ordinary least square:

5.0 %


DHR statistics

Temporal stability [1/decade]:


abs

rel


Weighted least square:

-0.0426505840329


Ordinary least square:

-0.0175298735109


Probabilities that GCOS criteria is met:

Weighted least square:

4.1 %

Ordinary least square:

4.7 %


Temporal anomaly analyis

The variance of the temporal anomalies provides an additional measure about the stability of the signal AFTER removal of the mean seasonal cylce.

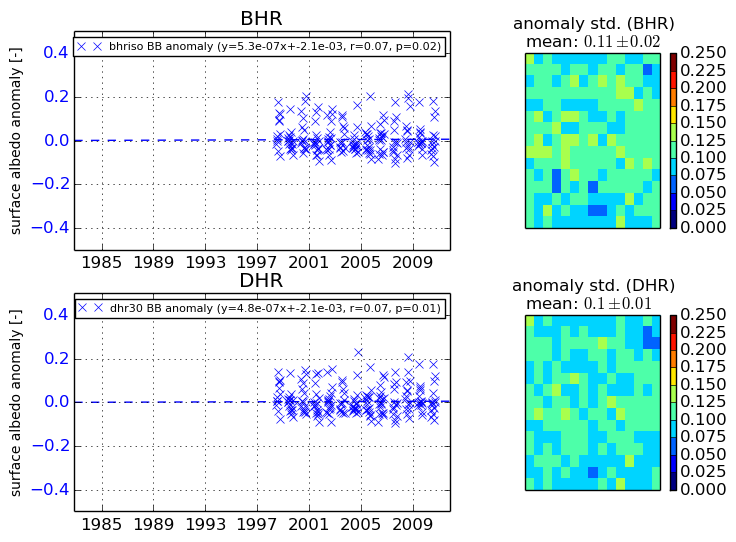
+000 deg


+057/+063 deg