KYIV-AO


Location

lon / lat [deg]: 30.498 / 50.4523

Source network: AERONET


Geostationary surface albedo (GSA) data


“+000”


“+057/+063”


Landcover information (based on ESA CCI landcover data)


Landcover fractions @ 2km distance


Landcover fractions @ 20 km distance


Legend


Distance to open water bodies [km]:

2.36

Distance to urban areas [km]:

0.11


Radius: 1 km

Number of landcover classes:

1

Dominant landcover type:

190: urban areas

Fraction of dominant landcover type [%]:

100.0


Radius: 2 km

Number of landcover classes:

1

Dominant landcover type:

190: urban areas

Fraction of dominant landcover type [%]:

100.0


Radius: 5 km

Number of landcover classes:

2

Dominant landcover type:

190: urban areas

Fraction of dominant landcover type [%]:

93.0


Radius: 10 km

Number of landcover classes:

5

Dominant landcover type:

190: urban areas

Fraction of dominant landcover type [%]:

81.0


Radius: 20 km

Number of landcover classes:

7

Dominant landcover type:

10: cropland, rainfed

Fraction of dominant landcover type [%]:

32.0


Disturbances


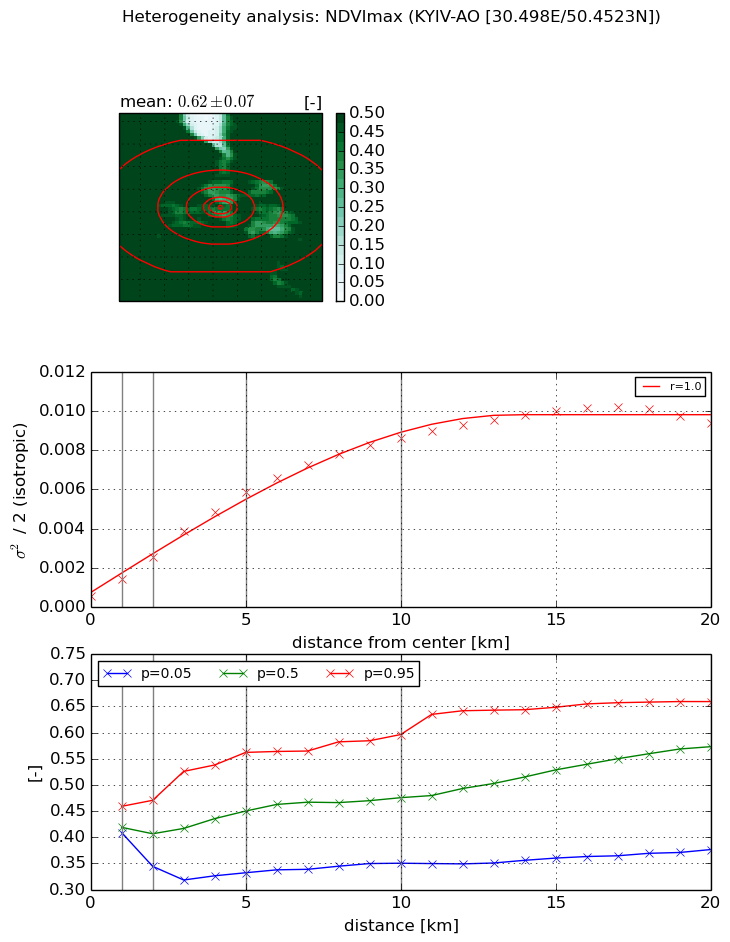
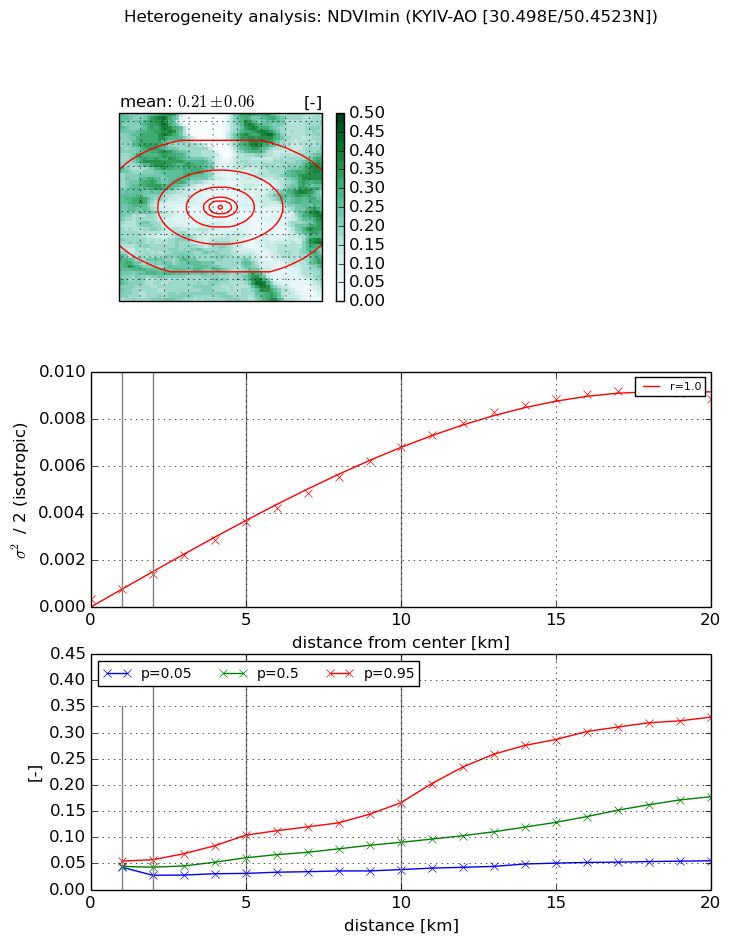
Heterogeneity analysis

The heterogeneity analysis provides information about the spatial and temporal heterogeneity of the site.

Topography


Roman et al. (2009) index


St

0.000144277881172

Rcv

0.2719654693

Rse

0.0

Rst

0.0122582222883

Rsv

20792.9238247


Height range @ 1km [m]

63

Height range @ 2km [m]

72

Height range @ 5km [m]

98

Height range @ 10km [m]

-999

Height range @ 20km [m]

-999


Variance slope @ 1 km

344

Variance slope @ 2 km

347

Variance slope @ 5 km

237

Variance slope @ 10 km

-999

Variance slope @ 20 km

-999


NDVI (max. NDVI composite)


Roman et al. (2009) index


St

11.2631225116

Rcv

0.0760053360918

Rse

0.0

Rst

-0.0522771502187

Rsv

0.138073490632


NDVI range @ 1km [-]

0.05

NDVI range @ 2km [-]

0.13

NDVI range @ 5km [-]

0.23

NDVI range @ 10km [-]

0.25

NDVI range @ 20km [-]

0.28


Variance slope @ 1 km

0.000864326483143

Variance slope @ 2 km

0.00099395448176

Variance slope @ 5 km

0.00108180102131

Variance slope @ 10 km

0.000833493071401

Variance slope @ 20 km

0.000445532314064


NDVI (min. NDVI composite)I


Roman et al. (2009) index


St

4.71330295887

Rcv

0.174470868404

Rse

0.0

Rst

-0.127437462315

Rsv

0.334587991749


NDVI range @ 1km [-]

0.01

NDVI range @ 2km [-]

0.03

NDVI range @ 5km [-]

0.07

NDVI range @ 10km [-]

0.13

NDVI range @ 20km [-]

0.27


NDVI slope @ 1 km

0.000449367948959

NDVI slope @ 2 km

0.000536084208024

NDVI slope @ 5 km

0.000671758707525

NDVI slope @ 10 km

0.000664918576978

NDVI slope @ 20 km

0.00047774351633


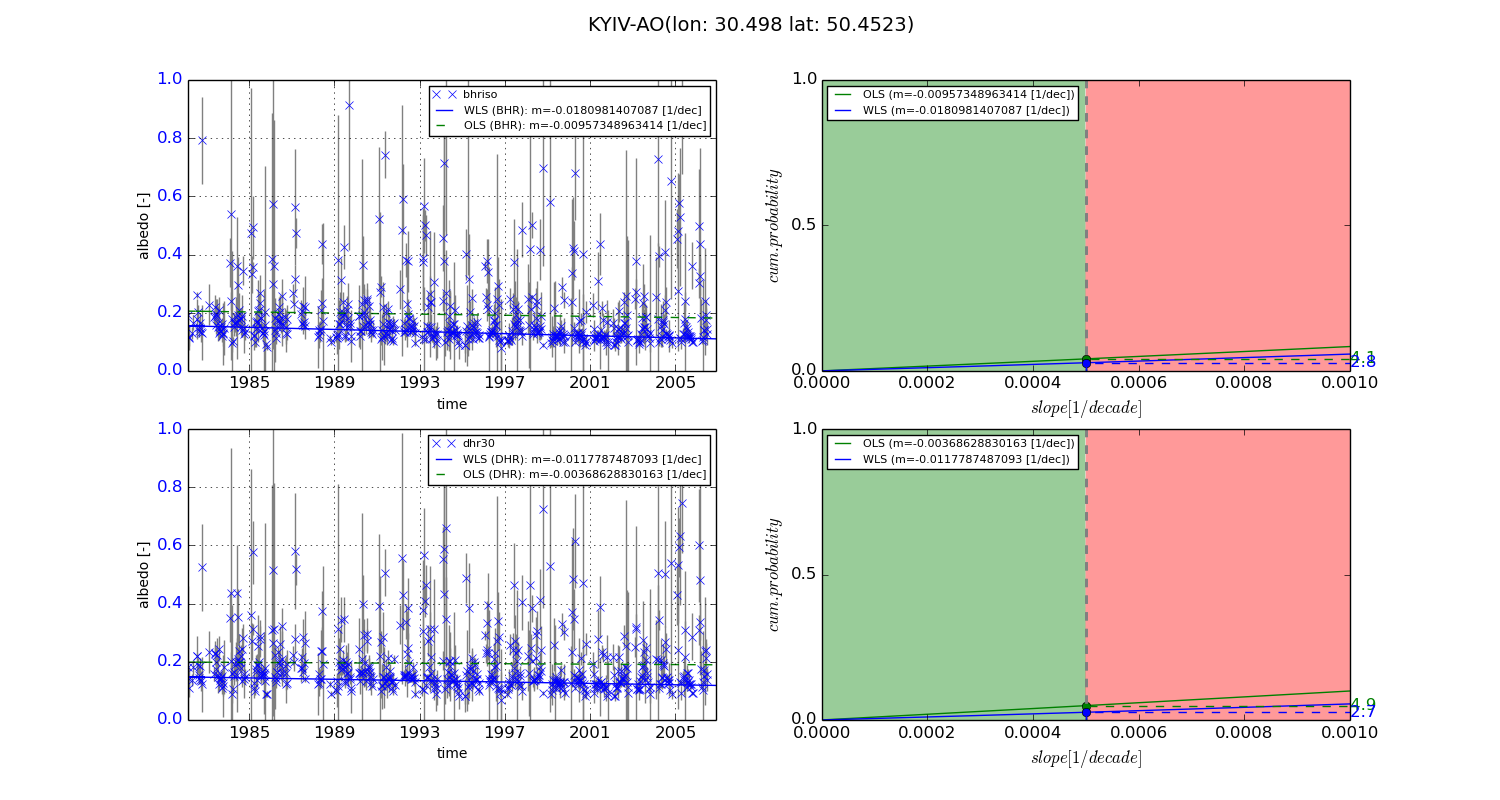
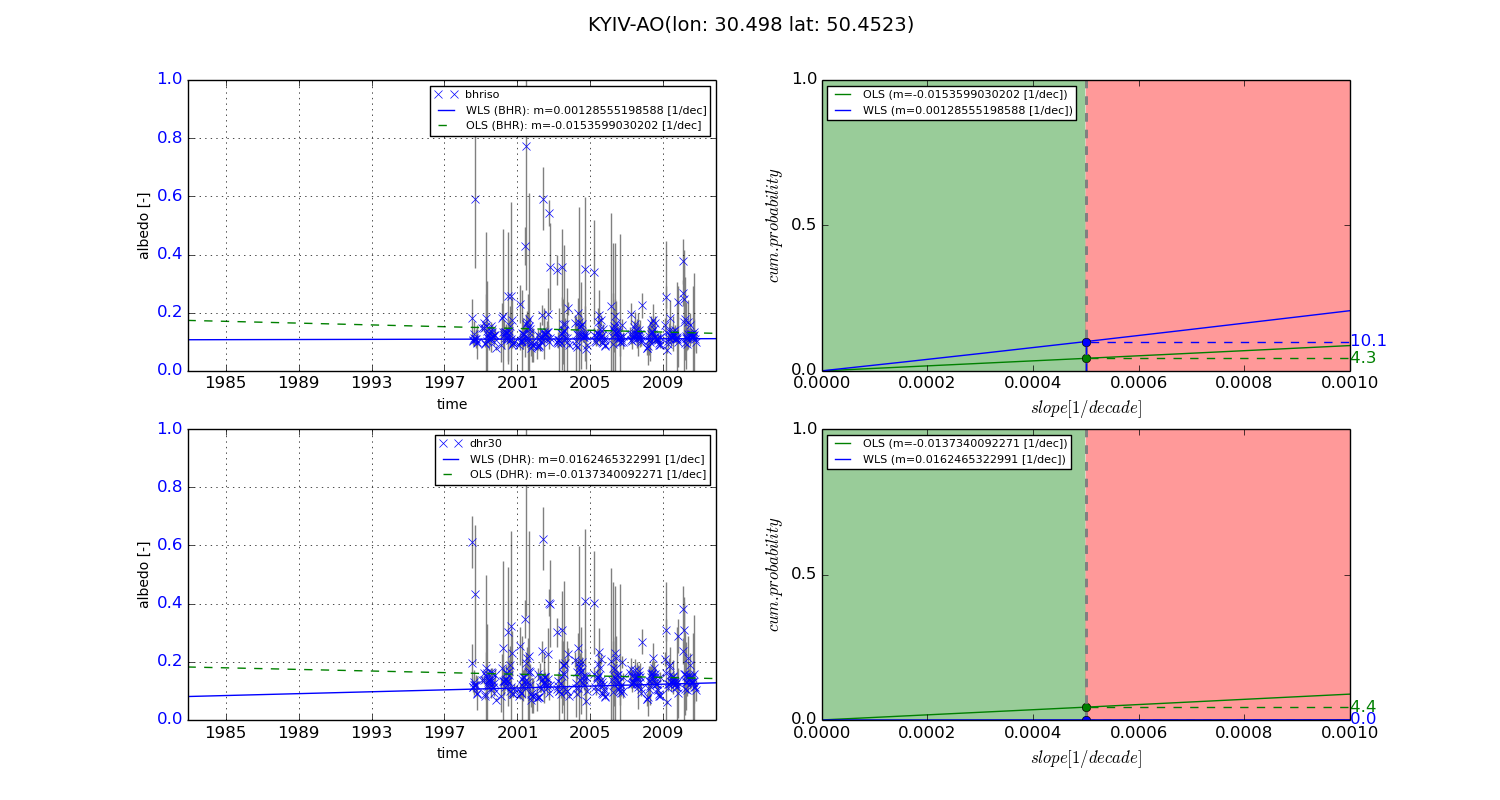
Temporal stability analysis

+000 deg (BHR)


BHR statistics

Temporal stability [1/decade]:


abs

rel


Weighted least square:

-0.0180981407087


Ordinary least square:

-0.00957348963414


Probabilities that GCOS criteria is met:

Weighted least square:

2.8 %

Ordinary least square:

4.1 %


DHR statistics

Temporal stability [1/decade]:


abs

rel


Weighted least square:

-0.0117787487093


Ordinary least square:

-0.00368628830163


Probabilities that GCOS criteria is met:

Weighted least square:

2.7 %

Ordinary least square:

4.9 %


+057/+063 deg (BHR)


BHR statistics

Temporal stability [1/decade]:


abs

rel


Weighted least square:

0.00128555198588


Ordinary least square:

-0.0153599030202


Probabilities that GCOS criteria is met:

Weighted least square:

10.1 %

Ordinary least square:

4.3 %


DHR statistics

Temporal stability [1/decade]:


abs

rel


Weighted least square:

0.0162465322991


Ordinary least square:

-0.0137340092271


Probabilities that GCOS criteria is met:

Weighted least square:

0.0 %

Ordinary least square:

4.4 %


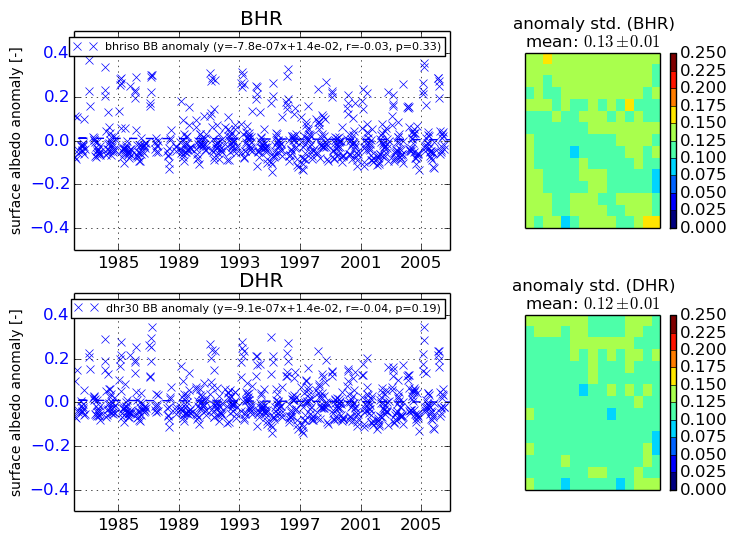
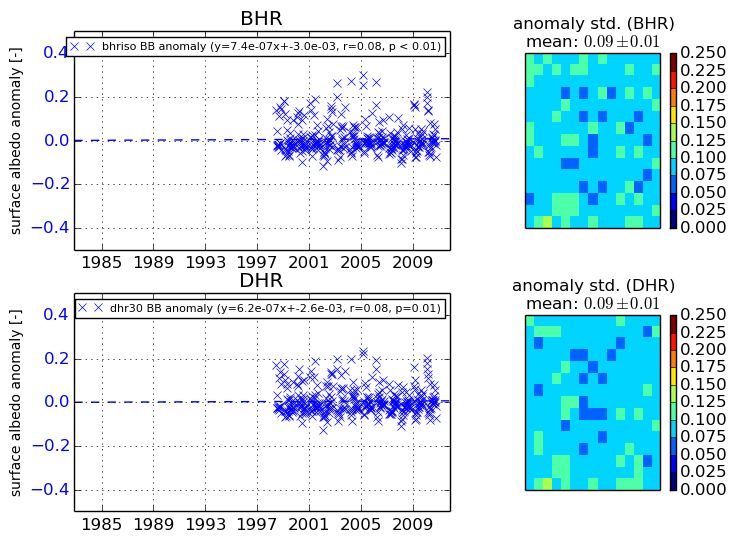
Temporal anomaly analyis

The variance of the temporal anomalies provides an additional measure about the stability of the signal AFTER removal of the mean seasonal cylce.
+000 deg


+057/+063 deg