LAKE_CILDER


Location

lon / lat [deg]: 43.17 / 41.05

Source network: ALBEDOVAL2


Geostationary surface albedo (GSA) data


“+000”


“+057/+063”


Landcover information (based on ESA CCI landcover data)


Landcover fractions @ 2km distance


Landcover fractions @ 20 km distance


Legend


Distance to open water bodies [km]:

0.17

Distance to urban areas [km]:

2.97


Radius: 1 km

Number of landcover classes:

2

Dominant landcover type:

210: water bodies

Fraction of dominant landcover type [%]:

98.0


Radius: 2 km

Number of landcover classes:

6

Dominant landcover type:

210: water bodies

Fraction of dominant landcover type [%]:

81.0


Radius: 5 km

Number of landcover classes:

7

Dominant landcover type:

210: water bodies

Fraction of dominant landcover type [%]:

51.0


Radius: 10 km

Number of landcover classes:

8

Dominant landcover type:

210: water bodies

Fraction of dominant landcover type [%]:

32.0


Radius: 20 km

Number of landcover classes:

10

Dominant landcover type:

20: cropland, irrigated or post-flooded

Fraction of dominant landcover type [%]:

24.0


Disturbances


Heterogeneity analysis

The heterogeneity analysis provides information about the spatial and temporal heterogeneity of the site.

Topography


Roman et al. (2009) index


St

3.95537223347e-10

Rcv

0.954131614681

Rse

0.0

Rst

1.51362322676e-09

Rsv

7584621174.81


Height range @ 1km [m]

5

Height range @ 2km [m]

141

Height range @ 5km [m]

553

Height range @ 10km [m]

-999

Height range @ 20km [m]

-999


Variance slope @ 1 km

4119

Variance slope @ 2 km

5936

Variance slope @ 5 km

9420

Variance slope @ 10 km

-999

Variance slope @ 20 km

-999


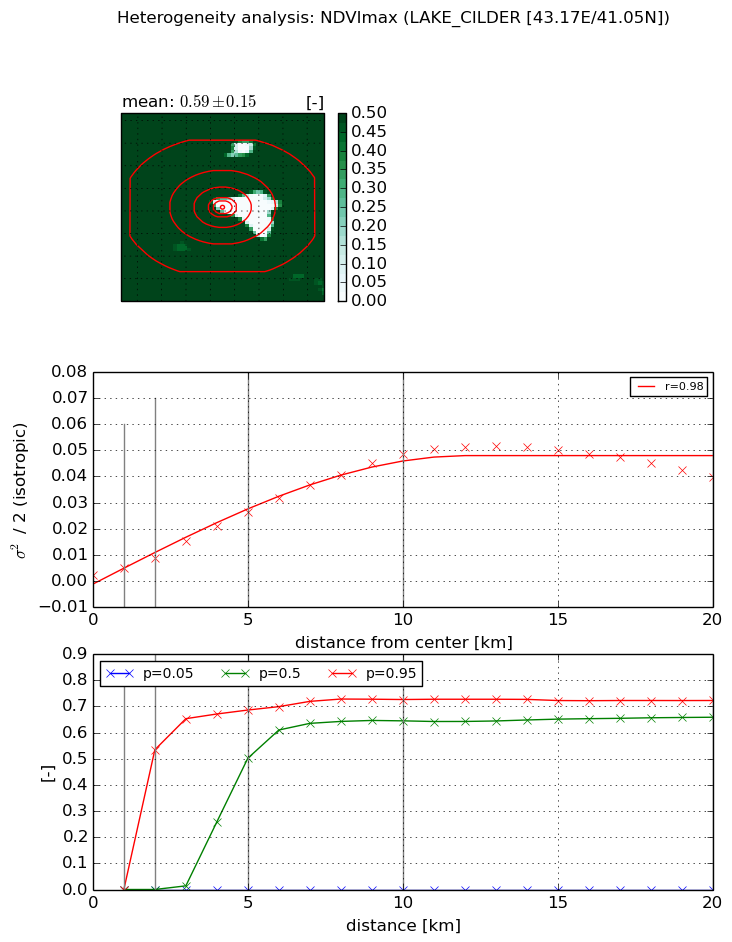
NDVI (max. NDVI composite)


Roman et al. (2009) index


St

4.42565103383e-07

Rcv

-0.31543015701

Rse

0.0

Rst

-0.019957582294

Rsv

6778663.36193


NDVI range @ 1km [-]

0.0

NDVI range @ 2km [-]

0.53

NDVI range @ 5km [-]

0.69

NDVI range @ 10km [-]

0.73

NDVI range @ 20km [-]

0.72


Variance slope @ 1 km

0.00285775364424

Variance slope @ 2 km

0.0033767337603

Variance slope @ 5 km

0.00497704073588

Variance slope @ 10 km

0.00490832936212

Variance slope @ 20 km

0.00215537006223


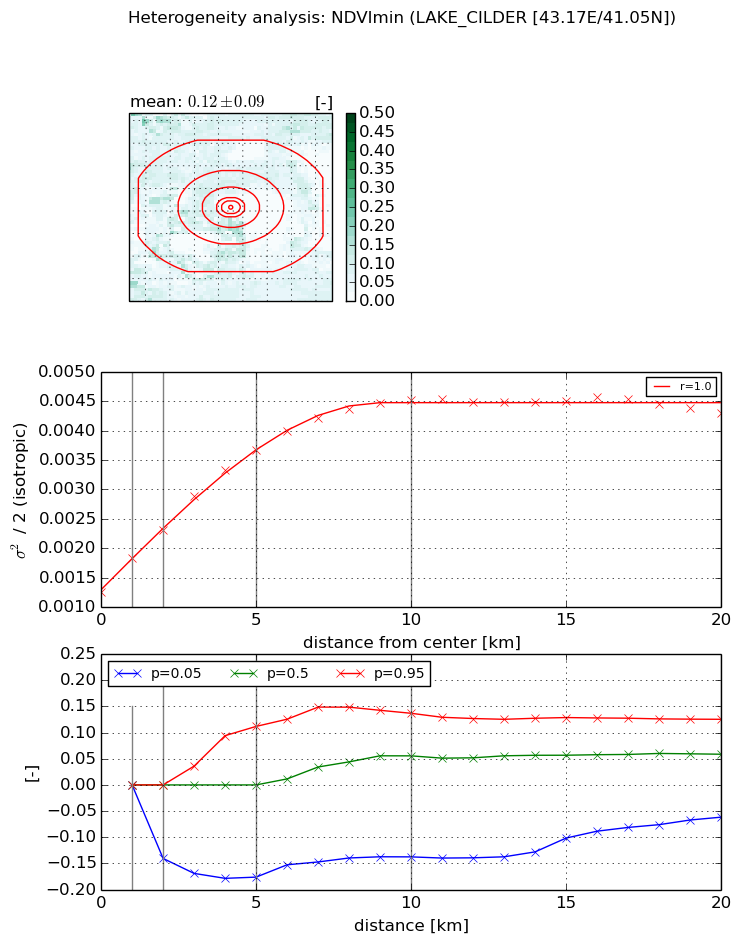
NDVI (min. NDVI composite)I


Roman et al. (2009) index


St

0.219742151408

Rcv

-12.7704033833

Rse

0.0

Rst

0.425144822192

Rsv

-0.456816535561


NDVI range @ 1km [-]

0.0

NDVI range @ 2km [-]

0.14

NDVI range @ 5km [-]

0.29

NDVI range @ 10km [-]

0.27

NDVI range @ 20km [-]

0.19


NDVI slope @ 1 km

0.000570862229997

NDVI slope @ 2 km

0.000523020099685

NDVI slope @ 5 km

0.000488129656201

NDVI slope @ 10 km

0.000330255581963

NDVI slope @ 20 km

0.000125846376373


Temporal stability analysis

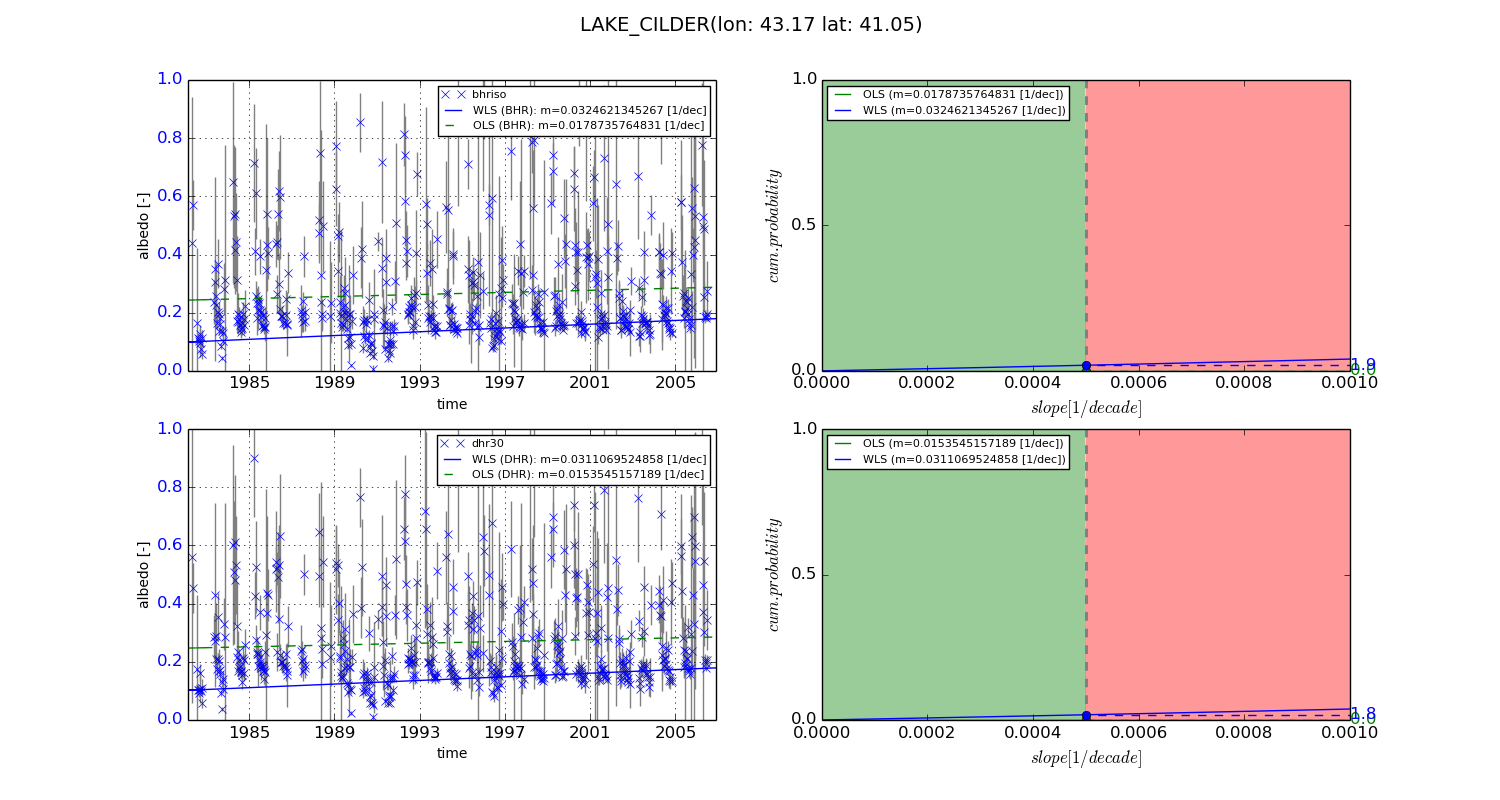
+000 deg (BHR)


BHR statistics

Temporal stability [1/decade]:


abs

rel


Weighted least square:

0.0324621345267


Ordinary least square:

0.0178735764831


Probabilities that GCOS criteria is met:

Weighted least square:

1.9 %

Ordinary least square:

0.0 %


DHR statistics

Temporal stability [1/decade]:


abs

rel


Weighted least square:

0.0311069524858


Ordinary least square:

0.0153545157189


Probabilities that GCOS criteria is met:

Weighted least square:

1.8 %

Ordinary least square:

0.0 %


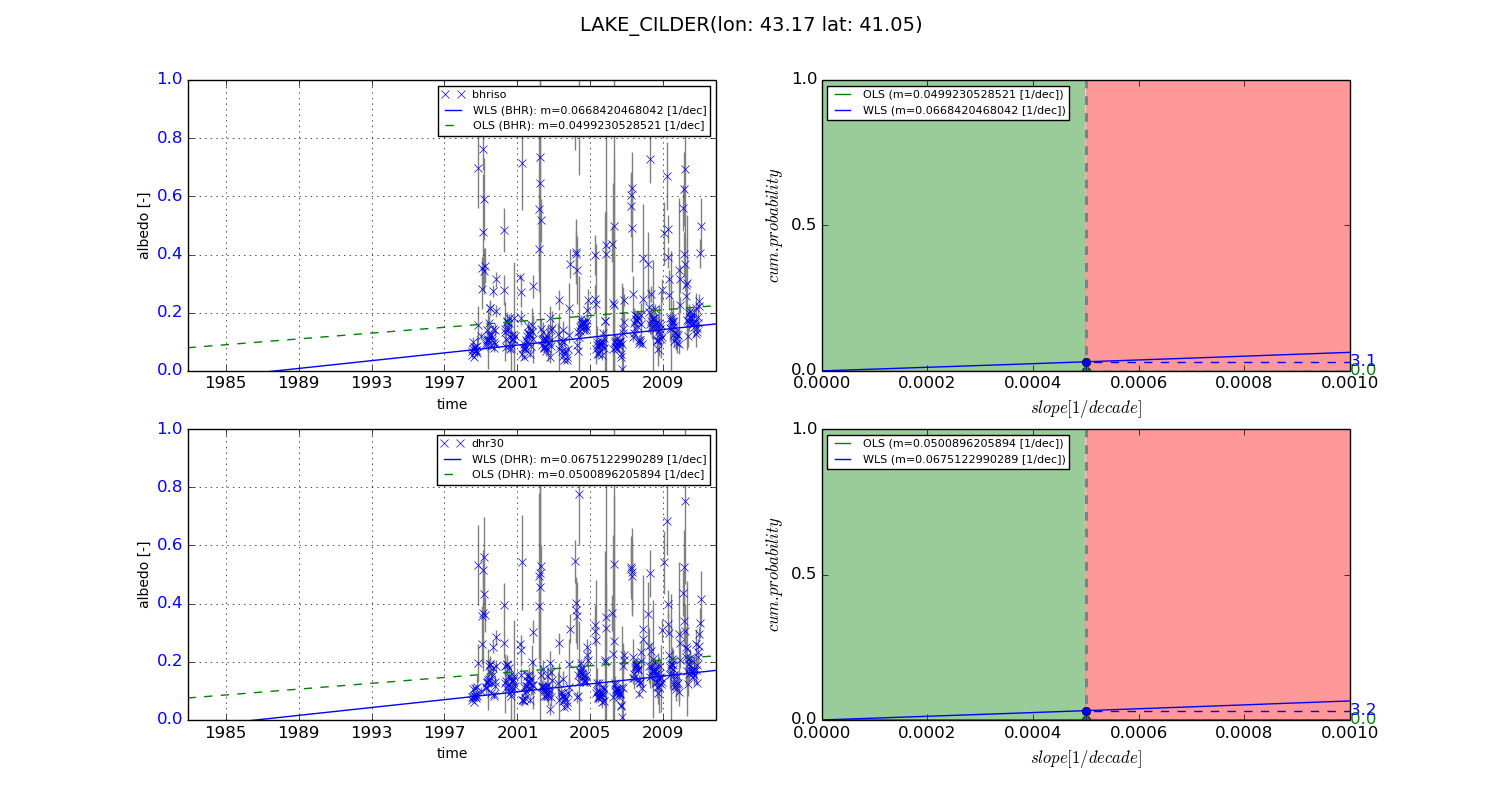
+057/+063 deg (BHR)


BHR statistics

Temporal stability [1/decade]:


abs

rel


Weighted least square:

0.0668420468042


Ordinary least square:

0.0499230528521


Probabilities that GCOS criteria is met:

Weighted least square:

3.1 %

Ordinary least square:

0.0 %


DHR statistics

Temporal stability [1/decade]:


abs

rel


Weighted least square:

0.0675122990289


Ordinary least square:

0.0500896205894


Probabilities that GCOS criteria is met:

Weighted least square:

3.2 %

Ordinary least square:

0.0 %


Temporal anomaly analyis

The variance of the temporal anomalies provides an additional measure about the stability of the signal AFTER removal of the mean seasonal cylce.
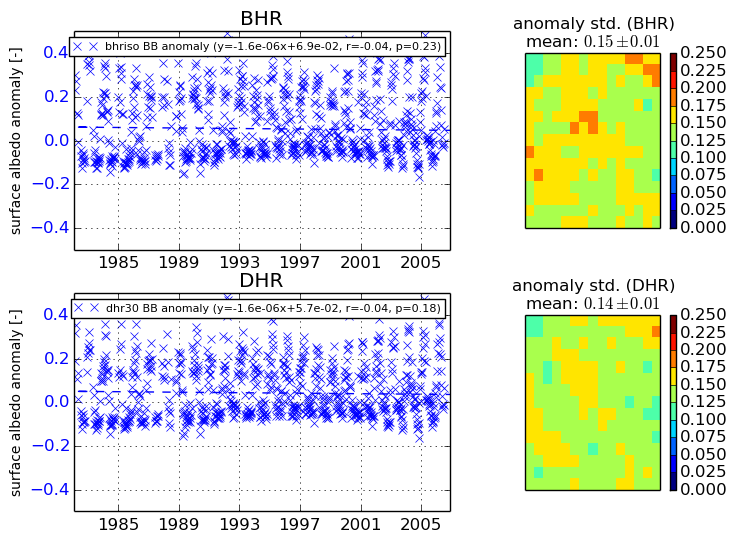
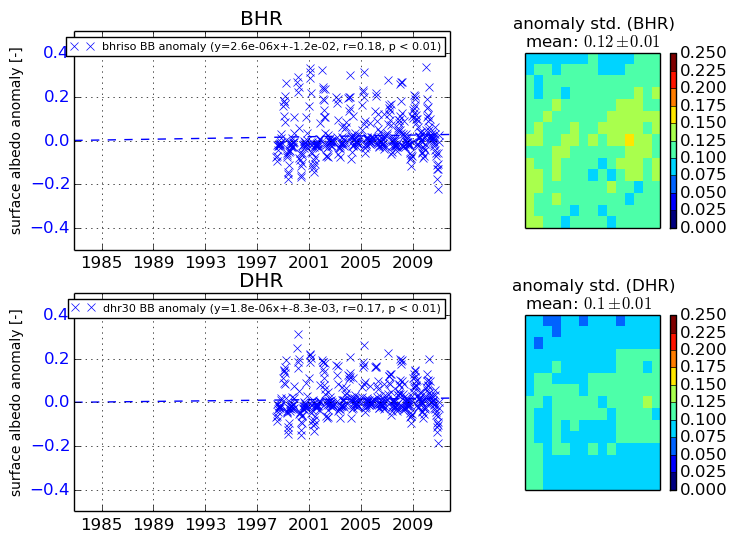
+000 deg


+057/+063 deg